DFMREI : Is Downtrend Over ?DFM:DFMREI (Dubai Financial Markets Real Estate Index)
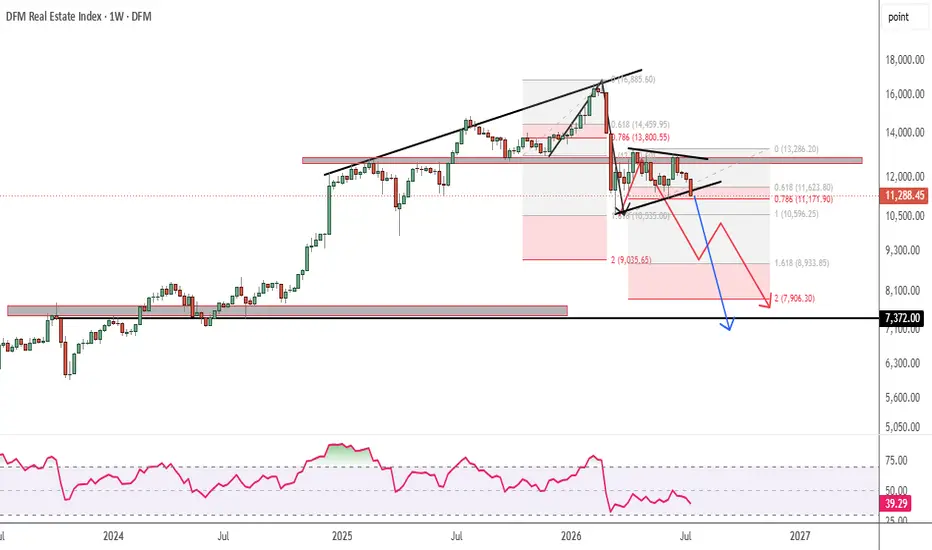
📉 Is the Downtrend Over? Reverse Fibonacci Suggests Another Leg Lower ⚠️
After rejecting from the 16.8k trendline resistance, the market continues to respect its broader bearish structure.
Here's what the chart is telling us:
🔹 The previous impulse moved from a 13k swing low to a 16.8k swing high, which also aligned perfectly with a major descending trendline resistance. Applying a Reverse Fibonacci Extension projected the 10.6k zone as the first major downside objective—and price respected it almost precisely during the sharp selloff triggered by the Middle East geopolitical conflict (highlighted by the black arrow).
🔹 The subsequent dead cat bounce stalled near 12.8k, a level that has repeatedly acted as both historical support and resistance, confirming it as a significant supply zone where sellers regained control.
What's Next?
Using the latest price structure:
Swing Low: 10.6k
Swing High: 12.8k
The prevailing trend remains bearish, with lower highs and lower lows still intact.
Projecting another Reverse Fibonacci 1.618 Extension identifies the 9k–8k demand zone as the next high-probability downside target (illustrated by the red path).
Adding further weight to the bearish outlook, the chart is also developing a Bearish Pennant / Bear Flag continuation pattern. If this structure confirms with a downside breakout, the measured move projects a final target around the 7.3k–7k region ( blue arrow marked )
Key Technical Confluences
✅ Reverse Fibonacci Extensions
✅ Bearish Pennant / Bear Flag Pattern
✅ Trendline Resistance Rejection
✅ Lower High–Lower Low Market Structure
✅ Historical Support & Resistance Flip
✅ Momentum Continuation Setup
My View
As long as price remains below 12.8k, rallies may continue to be selling opportunities rather than signs of a trend reversal.
A confirmed break below 10.6k could accelerate downside momentum toward the 9k–8k zone, while a completed bear flag projection opens the possibility of testing the 7k area.
What do you think? Is this simply another correction, or are we preparing for the next major leg down? Share your analysis below.
#TechnicalAnalysis #TradingView #PriceAction #ReverseFibonacci #FibonacciExtension #BearFlag #BearishPennant #ChartPattern #SupportAndResistance #TrendAnalysis #SwingTrading #MarketStructure #StockMarket #Crypto #Investing #Trading #Momentum #Breakdown #TrendFollowing #SmartMoney #VolumeAnalysis #ChartOfTheDay #TradeIdeas #MarketOutlook #Bearish
Btw, i had already shared the dead cat bounce scenario, proof below
Educational content only. Not financial advice.
 Long
Long
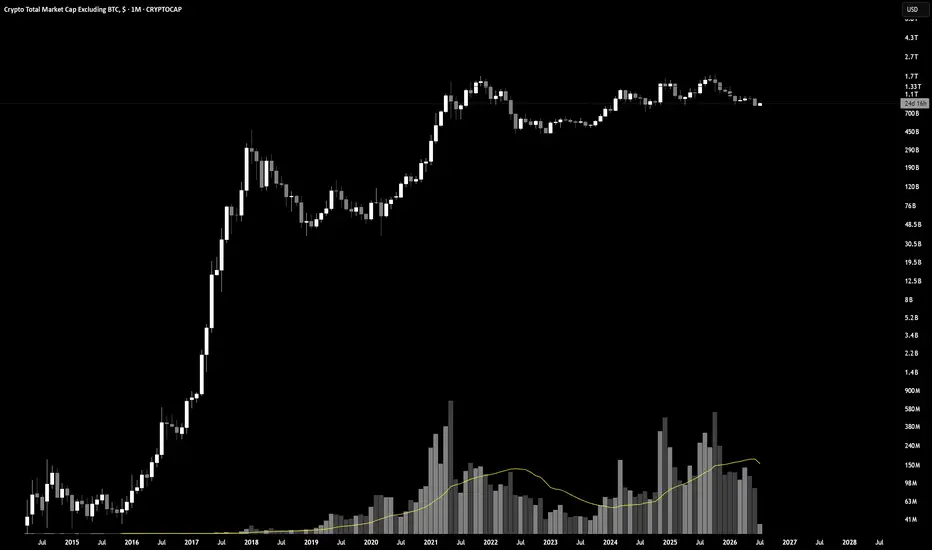
TOTAL2: Four-Year Reaccumulation Under the 1.33T CeilingThis is the widest possible lens on altcoin market cap, and the pattern only shows up at this zoom level. The 2017 cycle built one range, the 2021 peak built the next ceiling, and everything since has been compressing beneath that same 1.33T level for four straight years.
That's not distribution. Distribution would show declining lower highs into weaker and weaker bounces. This shows the opposite, repeated tests of the same ceiling with higher lows underneath each one, 2022's low, then 2023's, then a shallower base into 2024 and 2025. Each successive floor sits higher than the last.
In Wyckoff terms, this is a bull flag playing out as a multi-year reaccumulation schematic. The 2021 impulse was the initial markup. Everything since has been the market absorbing that move and building a new cause before the next effect, exactly the structure Continuation Acceleration Protocol treats as a regime gate still closed rather than a failed trend.
Volume tells the same story. The MA has been grinding higher since 2023 even as price has gone nowhere in absolute terms, participation quietly building underneath a flat price structure. That's classic absorption, aggressive selling met by aggressive buying at a level, without the level itself giving way.
The ceiling has rejected every test since 2021. That includes this cycle's most recent push. Until TOTAL2 closes a monthly candle above 1.33T with the range behind it instead of underneath it, this remains a base, not a breakout.
What invalidates the bullish read: a monthly close back below the 2024-2025 higher low structure, which would flatten the staircase and reopen the case for distribution instead. What confirms it: a monthly close above 1.33T, ideally with the volume expansion this base has been quietly building toward.
Marcus Aurelius wrote that the impediment to action advances action. Four years of failing to clear one number is either the longest rejection in crypto history or the longest base. The chart doesn't decide which. The next monthly close does.  Long
Long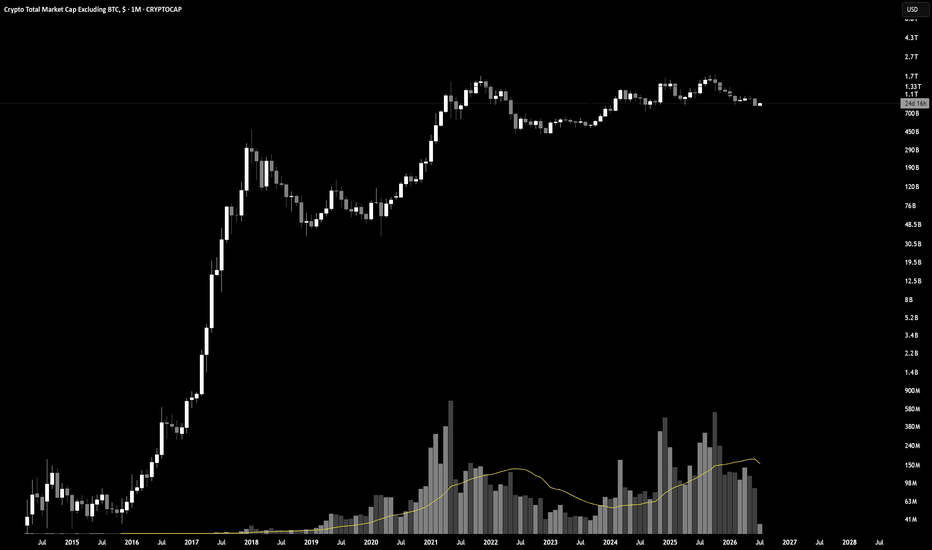
 Long
Long
 Long
Long
Kotak Mahindra Bank LtdKotak Mahindra Bank continues to look fundamentally steady and technically constructive, with the last four quarters reflecting resilience in core banking performance, stable asset quality, and a strong balance-sheet profile. The setup supports a measured bullish view for the coming quarter and full year, especially if momentum in loan growth and margins sustains.
Fundamental view — Last 4 quarters & guidance
Over the last four quarters, Kotak Mahindra Bank has shown a consistent operating profile with healthy advances growth, stable deposit traction, and controlled credit costs, which has kept earnings quality intact. The bank’s earnings trend has remained supported by prudent underwriting, strong capitalization, and a high-quality liability franchise, which reduces downside risk even in a choppy market.
For the coming quarter and the full year, the key watchpoints are loan growth acceleration, margin stability, fee-income momentum, and management commentary on retail and corporate credit demand. If the bank continues to deliver disciplined growth with stable asset quality, the market is likely to reward the stock with a premium valuation.
Technical view — RSI, MACD & bullish indicators
Technically, Kotak Mahindra Bank is showing a constructive setup with RSI holding in a healthy zone, indicating positive momentum without a strong overbought condition. MACD remains supportive of the trend, and broader chart structure suggests that buyers are active on dips.
Other technical indicators are also leaning bullish, including price holding above key short- and medium-term moving averages, a favorable higher-low structure, and improving volume on upward moves. This combination points to a stock that is still in a trend-friendly phase as long as support levels hold.
Recommendation
Buy Kotak Mahindra Bank at 405 with stoploss of 395 for targets of 411.55, 418.20, 425, 431.85, and 439.
This is a disciplined momentum-plus-quality banking trade with a tight risk profile and defined upside targets.
Disclosure
Disclosure: I am not a SEBI registered analyst or technical advisor. This post is for educational and informational purposes only and should not be considered investment advice.  Long
Long
Axis Bank Ltd.Axis Bank looks well placed both fundamentally and technically — the bank has delivered steady operating performance over the last four quarters with improving loan growth, margin stability, and controlled credit costs, which supports a constructive outlook for the coming quarter and year.
Technically, momentum indicators and other trend measures are in bullish zones, supporting a tactical buy while keeping risk management strict.
Fundamental view — Last 4 quarters & guidance
Over the last four quarters Axis Bank has shown sequential improvement in core metrics: healthy loan growth across retail and corporate segments, stable net interest margins, and improving asset quality with lower slippages and higher provisioning coverage; these trends have supported stronger operating profits and helped the bank build a firmer earnings base.
For the coming quarter and financial year, the Street will watch loan growth sustainability, margin resilience as funding cost dynamics evolve, CASA traction, and management guidance on credit costs and capital deployment, all of which will determine near-term sentiment.
Technical view — RSI, MACD & bullish indicators
On the chart, RSI is in a constructive zone, showing strength without extreme overbought signals, and MACD is positive with the signal line supporting upward momentum, which together indicate continuation potential for the current up-move.
Other technicals like price above short- and medium-term moving averages, bullish moving-average alignment, rising volume confirmation, and a clean higher-high/higher-low structure add conviction that buyers remain in control as long as key supports hold.
Recommendation
Buy Axis Bank at 1380 with stoploss 1334.00 for targets 1407.05, 1434.65, 1462.80, 1491.50, and 1520.75.
This is a momentum-plus-fundamental trade: enter with defined risk, trail stops as targets are reached, and re-evaluate if price breaches the stoploss or if fundamental guidance disappoints.
Disclosure
Disclosure: I am not a SEBI registered analyst or technical advisor. This post is for educational and informational purposes only and should not be taken as investment advice.  Long
Long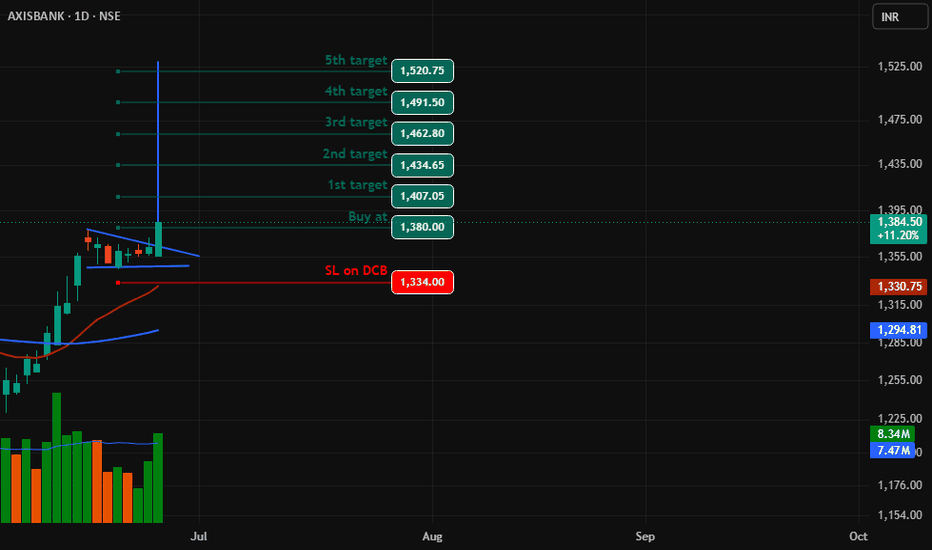
ICICI Bank remains fundamentally solidICICI Bank remains fundamentally solid — the bank reported steady quarterly improvements with Q4 FY26 showing core operating profit growth and FY26 PAT rising to about ₹50,147 crore, while asset quality improved and the board recommended a dividend, which underpins a constructive fundamental base for the coming year.
Technically, momentum indicators (RSI, MACD) and other trend measures are aligned with a bullish bias, supporting a tactical buy as long as risk rules are respected.
Fundamental view — Last 4 quarters & guidance
Over the last four quarters ICICI Bank delivered sequential improvement in core operating metrics, led by healthy loan growth, steady NII expansion, and improving asset quality (gross NPA trending down and higher provisioning coverage), which helped FY26 PAT rise year‑on‑year to ~₹50,147 crore and supported a dividend recommendation of ₹12 per share.
Key monitors for the coming quarter/year are loan growth sustainability (retail and corporate), margin trajectory amid funding cost moves, fee income momentum, and operating‑expense control — management commentary here will drive near‑term sentiment.
Technical view — RSI, MACD & bullish indicators
Daily and short‑term technical dashboards show supportive momentum: RSI sits in a constructive mid‑to‑upper range indicating room to run without extreme overbought readings, while MACD is positive and has recently signalled bullish alignment with rising histogram bars.
Other indicators — price trading above key short‑term moving averages, bullish moving‑average alignment on shorter windows, and positive volume confirmation on up days — add conviction that the chart structure is in a bullish phase, provided key supports hold.
Trading recommendation
Recommendation: Buy ICICI Bank at 1370 with stoploss 1333.00 for targets 1388.75, 1407.75, 1427.05, 1446.60, and 1470.
This is a tactical, momentum‑backed trade that combines improving fundamentals with constructive technicals; maintain discipline — cut if price breaches the stoploss or if key technical supports fail.
Disclosure
Disclosure: I am not a SEBI registered analyst/technical advisor. This post is for educational and informational purposes only and should not be treated as investment advice.  Long
Long
Long 
 Long
Long
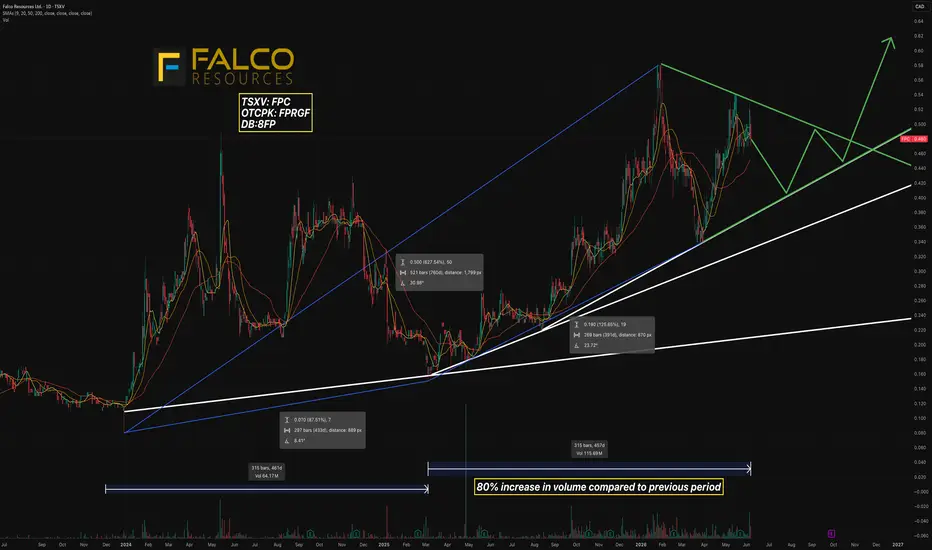
Falco Resources (TSXV) | Volume Expansion + Pennant SetupTSXV:FPC
One of the more interesting junior mining charts developing right now.
After a multi-year accumulation phase, FPC has constructed a clear bullish fan pattern. Each successive trendline break has resulted in a steeper rate of ascent, signaling increasing demand and strengthening market participation.
What's particularly notable is the volume profile.
The current advance has generated approximately 116M shares traded versus roughly 65M shares during the previous comparable period — an increase of nearly 80% . Rising volume accompanying a rising trend is often a sign that institutional and speculative interest is beginning to build beneath the surface.
Price is now compressing between a rising support trendline and declining resistance, creating the framework for a potential bullish pennant . The pattern is not yet complete, but continued consolidation above the rising trendline could set up a breakout attempt in the months ahead.
From a measured move perspective, a breakout from the pennant would project toward the $0.60-$0.65 range, representing the next major resistance zone.
Fundamentally, several catalysts could align with the technical structure:
• Horne 5 continues advancing toward the Québec ministerial decree, one of the most significant permitting milestones for the project.
• Updated feasibility study expected in 2026, incorporating substantially higher gold, copper, silver and zinc prices than the 2021 study.
• Horne 5 remains one of Canada's most advanced undeveloped polymetallic deposits, with projected annual production exceeding 220,000 ounces of gold alongside significant copper and zinc exposure.
• Falco recently identified multiple new exploration targets across the Western Noranda Camp, adding district-scale exploration upside beyond the flagship project.
• Detailed engineering, procurement work, and project advancement continue while the company moves toward potential development decisions.
The chart remains constructive as long as the rising support structure remains intact. A confirmed pennant breakout combined with continued fundamental progress could attract significantly more attention to the story.  Long
Long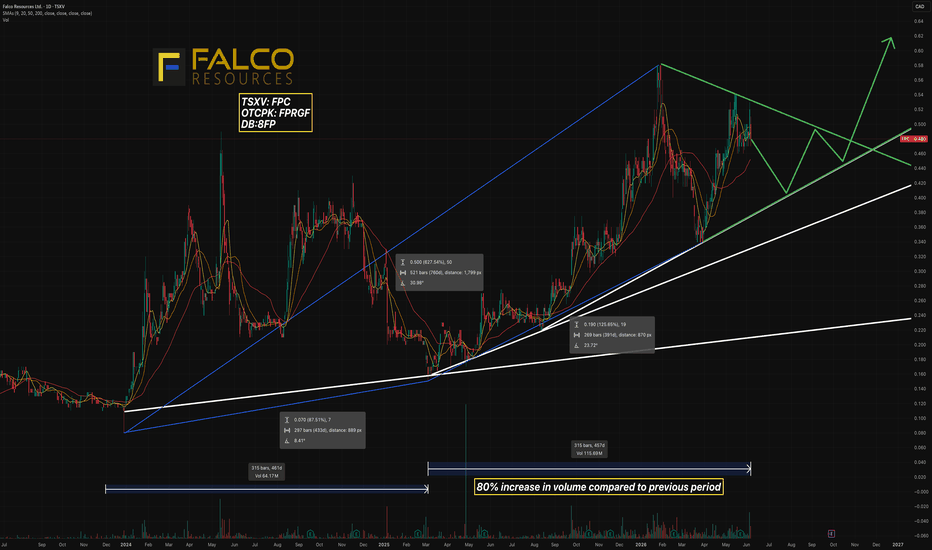
 Long
Long
 Long
Long
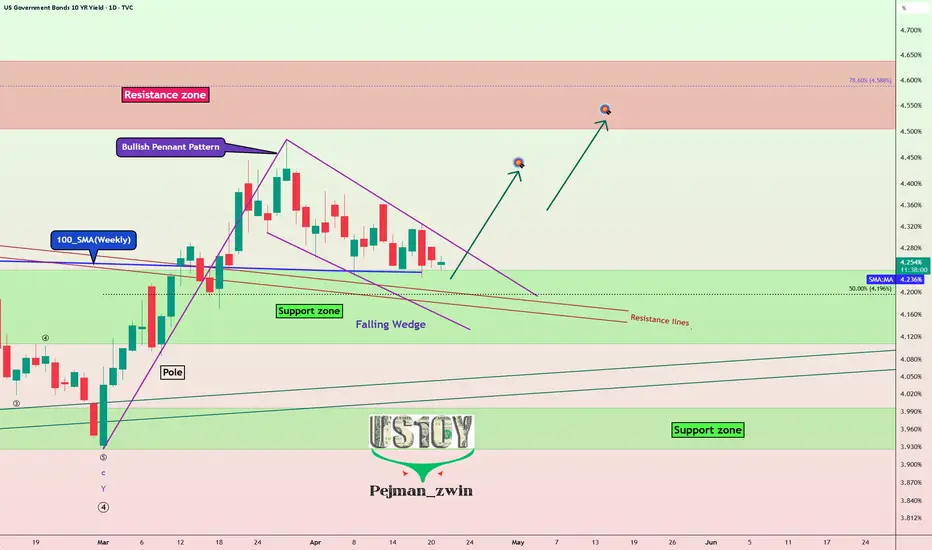
US10Y Is Waking Up — Major Markets Could Feel It!Today, we’re taking a closer look at the U.S. 10-Year Government Bond Yield ( TVC:US10 ) on the daily timeframe. This metric reflects the return investors earn from holding 10-year U.S. Treasury bonds and serves as a key indicator of market sentiment toward the U.S. economy. Because of its importance, movements in this yield play a major role in shaping capital flows across different asset classes and influencing overall financial conditions.
------------
Let’s look at US10Y on the daily timeframe—come along with me!
US10Y is currently near a support zone (4.24%-4.10%) and the 100_SMA (Weekly). It appears to be completing a pullback to the resistance lines it previously broke.
From a classical technical perspective, US10Y has formed a Bullish Pennant Pattern.
From an Elliott Wave perspective, it looks like US10Y has completed its main wave 4. With the bullish pennant pattern and a break of the resistance lines, we could see a new impulsive upward wave.
I expect US10Y, after breaking the upper line of the falling wedge, to gain at least about 4.43%.
First Target: 4.43%
Second Target: Resistance zone(4.64%-4.50%)
Stop Loss(SL): 4.15%
------------
How Rising 10-Year Bond Yields Influence Major Assets
When 10-year government bond yields move higher, they tend to reshape investor behavior across markets:
Bitcoin( BINANCE:BTCUSDT ) & Cryptocurrencies
As yields climb, capital often rotates toward safer, income-generating assets like bonds. This shift can reduce demand for high-risk assets such as Bitcoin, potentially leading to price pressure.
Gold( OANDA:XAUUSD )
Gold typically struggles in a rising yield environment. Since it doesn’t generate income, higher bond yields increase the opportunity cost of holding gold, which can weigh on its price.
U.S. Equities
Stocks, especially growth and tech sectors, may face headwinds. Higher yields usually mean higher borrowing costs, which can compress margins and slow down expansion for companies reliant on financing.
------------
What’s your view on US10Y? If US10Yr rises, could we see declines in gold, U.S. stock indices, and the cryptocurrency market?
💡 Please respect each other's opinions and express agreement or disagreement politely.
📌 US 10-Year Government Bond Yield Analyze (US10Y%), Daily time frame.
🛑 Always set a Stop Loss(SL) for every position you open.
✅ This is just my idea; I’d love to see your thoughts too!
🔥 If you find it helpful, please BOOST this post and share it with your friends.  Long
Long