Short
Short
 Long
Long
 Long
Long
$ETH Test or Breakout? Situation Review: 23/07BYBIT:ETHUSDT.P
Price broke through the nearest 📊M-IVZ resistance, which now acts as support, and held above. Upside momentum is present, but without clear backing from large capital.
What the metrics show:
• 🐋 Large capital on hold: 🐋Whale position via the Integrated Market Analysis (IMA) system remains neutral, without significant activity. No clear long or short bias — just observation.
• 📊 Buying pressure weak: Taker Ratio sits slightly above neutral — market buys are present, but without conviction.
• 🇺🇸 US session slightly more active: Yesterday's US trading saw volume pick up, but still far from "whales entering" territory.
Possible development:
If sellers fail to hold the current support zone at $1,850–$1,830, a breakdown toward $1,768 becomes possible — followed by a liquidity-sweep zone near $1,680, aligned with the maximum consolidation range of 📊IVZ. This aligns with classic price action: liquidity grabs often precede the next directional move.
Key observation points:
Price reaction at the support test is the primary indicator. Holding the level on rising volume with 🐋whale support could reinforce upside momentum. Losing support without a fight increases the likelihood of a quick liquidity sweep.
Until 🐋whales commit, any move remains in the uncertainty zone.
Analysis from me — execution from you 🚀
Platform restrictions limit the publication of closed indicators, so I display only the output of the 📊IVZ algorithm — institutional interest zones.  Long
Long
XAUUSD — 4,138 Break or Retest?Gold is still showing a strong short-term bullish structure.
After building a clear recovery from the 4,000 area, price pushed higher and is now trading around 4,125 - 4,130.
But the chart is now reaching an important resistance zone.
This is where many traders usually get emotional.
The move looks strong.
The candles look bullish.
But the best question is not:
“Should I buy now?”
The better question is:
“Can gold break 4,138, or does it need a retest first?”
The simple read
Gold is still respecting the rising trendline.
The short-term structure remains bullish while price holds above the 4,109 support area.
The nearest resistance is 4,138.
This zone is marked as the resistance / OB sell zone on the chart.
If buyers break and hold above 4,138, gold may continue higher and build a cleaner bullish continuation structure.
But if gold rejects from 4,138, a pullback toward 4,109 may appear first.
If 4,109 fails, the next important buy reaction zone is 4,084.
A deeper pullback could reach 4,054, where another OB buy zone is waiting near the rising trendline structure.
Key price zones
Current price area: 4,125 - 4,130
Main resistance / OB sell zone: 4,138
Short-term support: 4,109
First OB buy zone: 4,084
Deeper OB buy zone: 4,054
Bullish structure weakens below: 4,054
Trading plan
📈 Bullish breakout scenario
If gold breaks and holds above 4,138:
The bullish structure becomes stronger.
Buyers may try to continue the next upside move.
A cleaner buy idea needs a confirmed breakout or a successful retest above 4,138.
No clean hold above 4,138 = no strong confirmation.
📉 Retest scenario
If gold rejects from 4,138:
Price may pull back toward 4,109.
This would be a normal reaction after a strong move.
If buyers defend 4,109, gold may try another push toward 4,138.
If 4,109 breaks, I will watch 4,084 as the next important reaction zone.
📈 Deeper buy reaction scenario
If gold pulls back into 4,084 - 4,054:
This is where the chart becomes interesting again.
A clean bullish reaction from this zone could support another recovery attempt.
But if 4,054 breaks clearly, the short-term bullish structure becomes weaker and the market may need more time to rebuild.
Tiara’s View
Gold is bullish short-term, but the current price is close to resistance.
That is why I do not want to chase the candle.
I want to see whether buyers can truly control 4,138.
If they can, continuation becomes cleaner.
If they cannot, the market may retest 4,109 or 4,084 first. Short 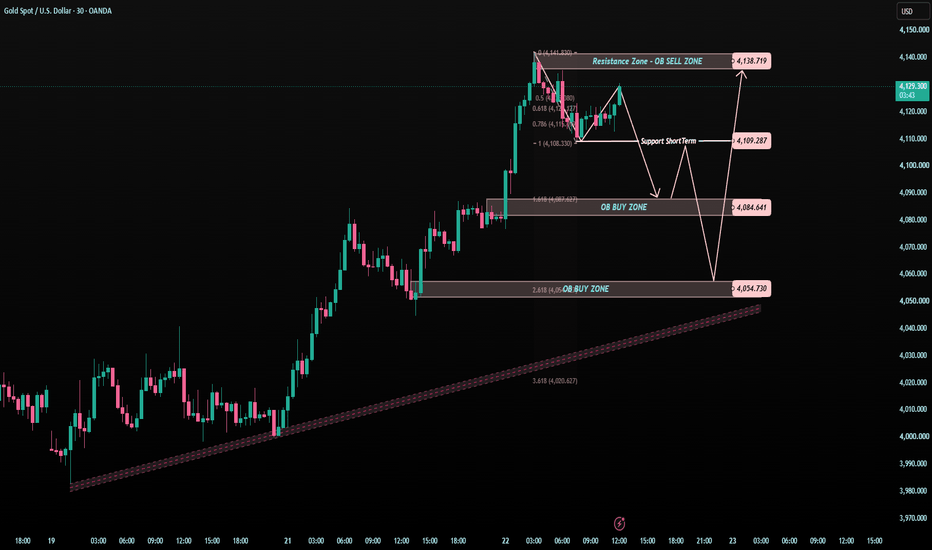
GBP/USD - Bullish Structure HoldsThe higher-time-frame outlook remains bullish. Market structure continues to hold, with price taking out intermediate highs while preserving the overall bullish framework. No significant lows have been violated, keeping the trend intact and maintaining the objective of reaching higher-time-frame external liquidity.
From an intermediate perspective, price has mitigated key higher-time-frame points of interest, adding confluence to the bullish bias. Along the way, internal liquidity has been taken and new liquidity has been engineered, which is consistent with a healthy bullish structural leg rather than a reversal.
Going into the new week, I’m expecting price to first sweep the current internal liquidity before mitigating lower-time-frame points of interest beneath price. If those areas fail to hold, I’ll anticipate a deeper engineered pullback into a larger liquidity pool before looking for continuation toward the premium objective. Regardless of the depth, my higher-time-frame bias remains unchanged until structure is invalidated.
The lower time frames are also aligned with the higher-time-frame narrative. Rather than chasing price, I’m waiting for sell-side liquidity to be taken and lower-time-frame points of interest to be respected before looking for long opportunities.
One detail worth noting is that the previous higher-time-frame lower high (highlighted by the purple zone) has already been broken. That shift reinforces the expectation that price has reset its objective and is now positioned to seek new external liquidity.
Note: The purple zones represent higher-time-frame confluence areas and are included as additional structural reference points—not standalone entry signals.
For now, patience remains the edge. I’ll continue tracking liquidity, waiting for my confirmations, and allowing price to come into my areas of interest before considering execution.
XAUUSD — 4,142 Rejected, 4,081 Next?Gold is still holding a short-term bullish recovery structure, but the market is now testing patience.
Price pushed into the 4,142 OB sell scalping reaction zone and started to slow down.
This is not a surprise.
After a strong move from the lower structure, gold is now meeting the first real resistance area.
So the question today is not:
“Is gold bullish?”
The better question is:
“Does gold need a healthy retest before the next push?”
The simple read
Gold is still trading above the rising trendline.
That means the short-term structure remains positive as long as buyers continue to defend the higher-low formation.
But price is currently below the 4,142 reaction zone.
If gold cannot reclaim 4,142, a pullback toward 4,081 may appear.
The 4,081 zone is very important because it is the OB buy zone and also connects with the rising trendline support.
If buyers defend 4,081, gold may try to build another recovery move toward 4,142 again.
A clean break above 4,142 would open the next upside target around 4,169.
Key price zones
Current price area: 4,110 - 4,120
First resistance / reaction zone: 4,142
Main resistance / OB sell zone: 4,169
Key OB buy zone: 4,081
Trendline support area: 4,081 - 4,090
Bullish structure weakens below: 4,081
Trading plan
📉 Retest scenario
If gold stays below 4,142:
Price may continue to pull back toward 4,081.
This would not automatically cancel the bullish view.
It may simply be a retest after the strong rally.
The key is how price reacts around 4,081.
No reaction from support = no buy.
📈 Bullish continuation scenario
If gold reacts from 4,081:
Buyers may try to push price back toward 4,142.
If gold breaks and holds above 4,142, the next target zone becomes 4,169.
A cleaner continuation setup needs confirmation above 4,142 or a strong reaction from the 4,081 support area.
📉 Weakness scenario
If 4,081 breaks clearly:
The short-term bullish structure becomes weaker.
Gold may need more time to rebuild momentum before another upside attempt.
In that case, I would avoid forcing a buy until price gives a new confirmation.
Tiara’s View
Gold is still improving, but the current price is not the cleanest place to chase.
The market has already touched the first sell reaction zone.
Now I want to see the retest.
For today, 4,081 is the key support zone.
If buyers protect it, the bullish structure remains alive.
If gold reclaims 4,142, 4,169 becomes the next important target.
Long 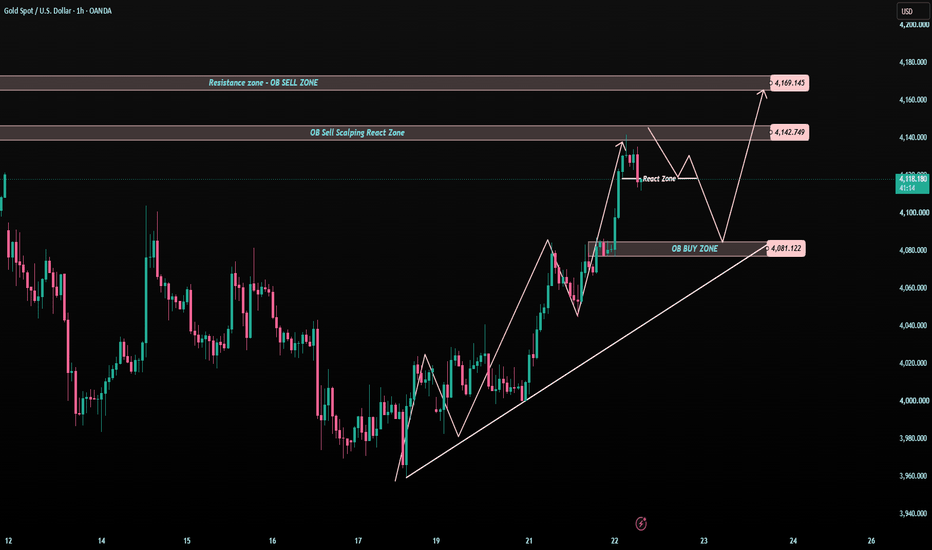
 Long
Long
 Long
Long
 Long
Long
 Long
Long
 Long
Long
 Long
Long
Trendlines: The Powerful Simplicity MisusedTrendlines are the simplest structural tool available, and one of the most consistently misused. Most are drawn to fit the price — connecting as many touches as possible until the line looks clean. That's backward, and it's why so many trendline breaks end up trapping the traders who acted on them.
A trend starts with a pivot — the point where the new directional move actually begins. What comes after it is a pullback, and that pullback's extreme becomes the second anchor. Connect those two points and the trendline exists. Nothing about drawing it correctly involves fitting a line to as many candles as possible — it's two structural points, not a best-fit approximation.
That second anchor is doing more work than most traders give it credit for. Once price continues past the prior high or low following the pullback, that pullback point stops being just a pause in the move — it becomes a level where positions are actually anchored. Participants who used that pullback as their reference have stops resting beyond it. That resting interest is the trendline's real liquidity, and it's a specific price — a horizontal level — not the diagonal line connecting to it.
This is exactly why a trendline drawn to touch as many points as possible is the wrong approach. A line fit to price rather than to structure isn't marking anything participants actually anchored to. It looks clean. It means nothing. A trendline that gets violated repeatedly without consequence confirms as much — each violation consumes whatever resting interest gave the line its weight in the first place, the same way a level tested too many times stops producing a reaction.
Notice the distinction this creates: the diagonal line is a visual aid. The actual invalidation point is the horizontal level at the second anchor — the trendline liquidity. Those are not the same thing, and confusing them is where most trendline trading goes wrong.
A trending move pulling back through the diagonal line is not the same event as price taking out that second anchor. The line can be crossed while the actual structural point — the liquidity that matters — is still untouched. This is exactly why traders who treat a trendline break as a reversal signal so often end up trapped: they're reacting to the diagonal being crossed, not to any structural level actually giving way. The position they took was never validated by anything real, because the level that would have validated it — the trendline liquidity — was never taken.
Trendlines also aren't static once drawn. As a trend progresses and produces new pullbacks, the trendline needs to be redrawn to the most recent one — otherwise it's tracking a structural point the market has already moved past, not the one that currently matters. And when price does cross the old diagonal without taking the actual liquidity behind it — an unconfirmed break — and then reclaims the prior high or low that preceded that break, the trendline gets updated again: the new second anchor becomes the low or high of that unconfirmed break itself, and that's the new trendline liquidity to track going forward.
There's one situation where this update looks slightly different: when price, instead of cleanly reclaiming the prior high or low, moves into a range. A clean continuation gives a straightforward new anchor. A range doesn't — there's no clean break past the prior structural point to confirm against. What the range does contain is its own internal trending structure: smaller pivots and pullbacks forming within it. When that internal structure starts trending again in the original direction, that resumption itself functions as a new trend starting point — even though it hasn't validated the new trendline liquidity the normal way, by continuing past the actual prior high or low. This gets marked as a multi-layer trendline rather than a standard one: built from the internal structure's own reference points instead of the full confirmation, the unconfirmed version of the same continuation. Track it with the same seriousness as a confirmed update — it's resting on a lower-degree confirmation, not a weaker idea.
Look at a trendline you're currently watching. Is the second anchor a genuine pullback point that price has validated by continuing past it — or is the line just fit to touch as many candles as it could?  Education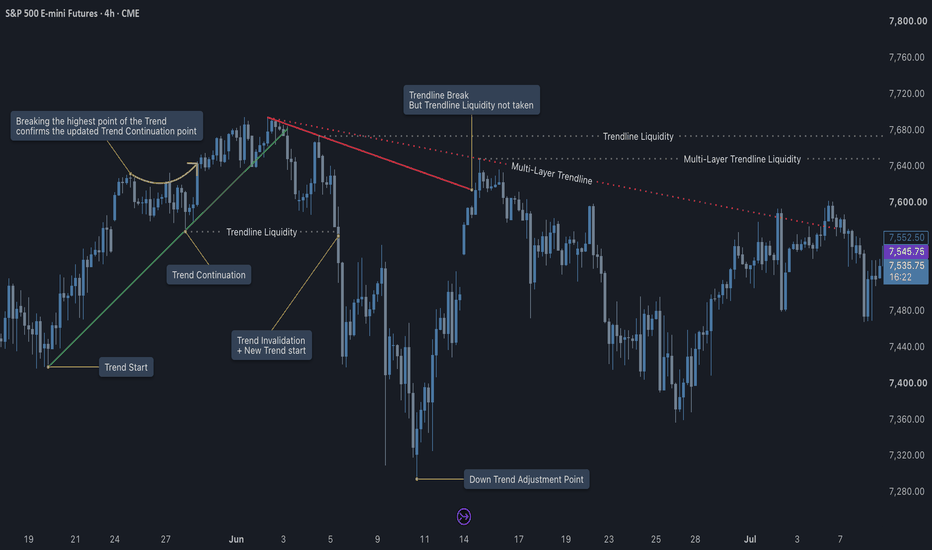
 Long
Long
Nifty Analysis EOD – 24 July, 2026 – Friday🟢 Nifty Analysis EOD – 24 July, 2026 – Friday 🔴
Gap Down, Grind Up: Bulls Recover 189 Points but Stall Below PDL
🗞 Nifty Summary
Nifty opened with a 207-point gap down, driven by geopolitical tensions and a rise in crude prices. The opening tick landed very close to the gap support level of 23,630 and the LTF trendline — a meaningful confluence. From there, the index found a base just 27 points below the open and bounced 89 points within the first five minutes, marking the IBH at 23,764.
What followed was a bit messy. Price came back down, slipped below the CDO, and broke the 23,630 level — essentially forming a new IBH below that zone after some consolidation. Then came the sharp leg up: a 189-point recovery that pushed all the way to the PDL, where it ran into resistance.
After that test, Nifty settled into a tight 45-point range between the IBH and PDL for the rest of the session. The day ended right in this zone at 23,787, just near the PDL. A clear doji-like close — the gap down absorbed, recovery attempted, but no real conviction either way heading into the weekend.
For Monday, the 23,785 ~ 23,825 band remains the key zone to watch. A clean hold above could invite another push higher; a slip below might bring 23,630 back into focus.
🛡 5 Min Intraday Chart with Levels
📉 Daily Time Frame Chart with Intraday Levels
🕯 Daily Candle Breakdown
Open: 23,666.35
High: 23,823.60
Low: 23,606.30
Close: 23,767.45
Change: −102.15 (−0.43%)
🏗️ Structure Breakdown
Type: Bullish-bodied candle with upper wick dominance — buyers stepped in, but sellers capped the top
Range: ≈ 217 points — moderate volatility
Body: ≈ 101 points — mild buyer pressure, close above open but well off the high
Upper Wick: ≈ 56 points — supply presence near PDL, sellers active at the top
Lower Wick: ≈ 60 points — demand absorbed the gap, buyers defended the support zone
🛡 5 Min Intraday Chart
⚔️ Gladiator Strategy Update
ATR: 228.10
IB Range: 144.25 → Medium
Market Structure: ImBalanced
Trade Highlights:
09:58 Long Trade: SL Hit
10:33 Long Trade: Target Hit (R:R 1:7.42)
12:44 Long Trade: SL Hit
13:30 Short Trade: SL Hit
14:18 Short Trade: SL Hit
Trade Summary: The 10:33 long was the bright spot — a clean 1:7.42 R:R that did what the system is built to do. The four SL hits that followed weren't a system failure; the market was whipsawing and the setups were just getting chopped. The hard and real lesson today is simpler than that — after booking a profit like that, I should have closed the terminal and walked away.
🧱 Support & Resistance Levels
Resistance Zones: 23,785 ~ 23,825 | 23,920 | 23,975 | 24,030
Support Zones: 23,675 ~ 23,630 | 23,500 | 23,400
🧠 Final Thoughts
“A big win early in the day is not permission to trade the rest of it.”
Today was a reminder that the market doesn’t owe a follow-through just because one trade worked well. The 10:33 long delivered a beautiful 1:7.42 — the kind of trade the system is designed to catch. But I caught by three SL in those 45-point whipsaw; a good day had become an ordinary one.
The levels for Monday are fairly clear — 23,785 ~ 23,825 is the immediate zone to watch. If there's no fresh geopolitical news over the weekend, the LTF trendline and 23,630 support might hold their ground and slowly open the door toward 24,000 levels. A breakdown below 23,630 on any negative development, though, and the picture changes quickly.
✏️ Disclaimer
This is my personal digital diary and represents my own analysis and point of view. It is not financial advice; please consult a professional advisor before making any trading decisions. SPY Tests Its 20/50-Day Cluster as the Broader Uptrend HoldsThe broad trend is still constructive, but the short-term chart is testing whether support can absorb a loss of the fast moving-average cluster.
Introduction
AMEX:SPY, the State Street SPDR S&P 500 ETF Trust, is examined here on the 1D chart as of 24 July 2026, before the regular US session. This is a neutral technical study for education, Bar Replay and paper-testing. The orange pre-market quote was still moving, so the analysis treats only the visible regular-session daily candle as completed.
Current market structure
Over the one-year view, SPY advanced through a sequence of higher highs and higher lows, interrupted by a sharp March–April correction. The rebound from that spring low recovered the prior consolidation and later reached new highs around the mid-750s. That keeps the broad daily structure upward.
Near term, however, price is no longer advancing cleanly. The June–July action is better described as a range between roughly 726–735 support and 748–755 resistance. Repeated reactions inside this band, followed by the latest bearish candle, make the short-term evidence mixed rather than strongly directional.
Important support and resistance
The nearest support zone is 726–735. It contains several recent lows, closes, and the lower edge of the current consolidation. It is also where buyers previously responded after a sharp intraday selloff. A daily close beneath the zone would be more informative than a brief intraday wick.
Resistance is 748–755. Recent highs and failed pushes cluster there, and price has repeatedly struggled to hold above the upper edge. Because those reactions span several sessions, treating resistance as a zone is more realistic than using one exact price.
Moving-average and volume evidence
At the latest completed candle, SPY closed 738.18, below the 20-day SMA at 745.92 and the 50-day SMA at 745.05, but above the rising 200-day SMA at 698.21. The 20- and 50-day averages are tightly grouped near 745, so they act as a nearby decision area. This conflicts with the broader uptrend: long-term structure is intact, while short-term momentum has weakened.
Volume on the latest candle was 55.44 million shares. That is above several nearby sessions in the mid-30 to mid-40 million range, but below recent 60–70 million sessions and well below the heaviest 80-plus million readings visible in the range. The decline therefore received some participation, but not exceptional volume confirmation.
Key candle behaviour
The latest completed daily candle opened 739.37, traded up to 742.56, fell to 735.21 and closed at 738.18. It stayed below the nearby moving-average cluster and finished in the lower half of its range. Read as an observation, that is a failed short-term recovery attempt; as an interpretation, it keeps pressure on support. The separate pre-market quote was still open and is not treated as confirmation.
Bullish conditional scenario
A daily close back above 745–748 would reclaim the 20/50-day cluster.
Follow-through above 755, ideally on volume clearly stronger than the recent mid-range, would strengthen the higher-high structure.
Holding 726–735 on pullbacks would preserve the consolidation as a potential base rather than a breakdown.
Bearish conditional scenario
Repeated rejection below 745–748 would keep the fast averages acting as overhead resistance.
A completed daily close below 726, especially with volume expanding beyond the recent range, would weaken the current consolidation.
Failure to recover after such a break would expose the next visible area around 710–716, while the rising 200-day average near 698 remains the broader reference.
What would invalidate the analysis
This analysis would need to be revised if SPY closes decisively outside 726–755 and then holds there, because the range framework would no longer describe the chart. A confirmed break above 755 would invalidate the short-term weakening case. A sustained break below 726, followed by lower highs and lower lows, would invalidate the present assumption that the broad uptrend is merely consolidating. Unexpected volatility or a large gap could also make these zones less useful.
How to test the idea with Bar Replay
Start before the March–April correction and hide future candles.
Mark 726–735 and 748–755 without looking ahead.
Advance one daily candle at a time and record closes relative to the 20-, 50- and 200-day averages.
Compare breakout and rejection volume with the preceding ten sessions.
Paper-test both conditional scenarios and note which confirmations reduced false signals.
Educational disclaimer
Educational disclaimer: This Idea is a historical chart observation, not personalized investment advice or a promise of results. Markets can gap, trend or reverse without confirmation. Use Bar Replay or paper trading, wait for completed candles, and make independent decisions appropriate to your own circumstances.