Ethereum is about to explode (1H)Ethereum is showing a bullish structure, and on the higher timeframes, there appears to be no major resistance preventing the price from moving toward the $3,000 area.
As long as the bullish structure remains intact, we can look for buy/long opportunities at the marked support zones and trade in the direction of the prevailing trend.
During its previous move, Ethereum has already collected liquidity from the lower levels of the chart, which supports the possibility of further continuation to the upside.
We have two marked entry zones, and the position should be built using a DCA approach as price reaches these levels. The targets are clearly marked on the chart, and partial profits should be secured at each target as the price moves in our favor.
If the stop-loss level is hit, the setup will be considered invalid and we will exit the position.
If you have a symbol you want analyzed, first hit the like button and then comment its name so I can review it for you.
Do you also think Ethereumis bullish?
Pivot Points
GBPNZD: A Strong Rally Meets a Selling Zone — Is 2.3000 Back?Market Overview: A Crucial Test for the Rally
📌GBPNZD has made a strong recovery, but buyers are approaching an area that could test their conviction. After an extended move higher, the question is whether the market can sustain its momentum as it returns to resistance.
📌On the shared 8-hour chart, price is around 2.34044, just beneath the marked 2.3415–2.3450 premium selling zone. The preferred scenario is a bearish reaction from this area, with 2.30046 as the larger downside objective if sellers regain control.
The Recent Rally: Why Selling Too Early Carries Risk
📌The recovery from the late-August lows around 2.2800 has been significant. Buyers pushed through several previous swing highs, creating the bullish breaks of structure marked on the chart. These breaks show that demand was strong enough to overcome earlier resistance.
📌That strength deserves respect. A market can continue climbing even when it looks expensive, so the bearish setup needs evidence that the recent buying pressure is fading.
Change of Character: The First Warning for Buyers
📌Following the recent high near 2.3490, price declined through local support around 2.3320–2.3330. The chart identifies this as a change of character, or CHoCH.
📌For retail traders, this means the recent bullish sequence has suffered a structural interruption. It is an early warning that momentum may be changing. A rebound that stalls below the recent high would create a potential lower high and strengthen the case for further weakness.
Premium Selling Zone: Where the Rebound Faces Resistance
📌The main area of interest sits around 2.3415–2.3450, where the chart highlights potential selling pressure. The rebound is returning toward the area from which the previous decline developed, making the next reaction particularly important.
📌In SMC terms, “premium” describes the upper portion of the relevant price range. It helps identify a location to watch for shorts, but the zone itself does not confirm an entry. Sellers still need to demonstrate that they can stop the recovery.
Entry Confirmation: Wait for Sellers to Take Control
📌A stronger bearish setup would involve rejection inside the selling zone, followed by a clear move away from it. Repeated upper wicks, a failed breakout, or a decisive bearish candle would provide initial evidence of resistance.
📌For a more structured entry, I would look for a lower-timeframe break below the rebound’s most recent higher low. A retest that holds as resistance would add confirmation and provide a clearer reference for managing risk. One isolated rejection wick would leave the setup less convincing.
Downside Targets: Follow the Move Through Each Support Area
📌The first area to monitor is 2.3300–2.3320, around the recent structural break and pullback. A sustained move below it would bring 2.3250 into focus. This previous bullish breakout level could attract buyers again, so the reaction there matters.
📌Below 2.3250, the shaded demand areas around 2.3145–2.3175 and 2.3090–2.3125 become the next checkpoints. Either could produce a bounce or slow the decline. Traders already positioned could use these reactions to assess whether to reduce exposure or secure partial profits.
📌The larger target marked on the chart is 2.30046, close to the psychological 2.3000 level. Reaching it would require sellers to overcome the intermediate support areas. All zone boundaries quoted here are approximate; 2.30046 is the chart’s explicitly labelled target.
Invalidation: What Would Change the Bearish View?
📌The selling-zone thesis weakens if price closes firmly above 2.3450 and begins holding that level as support. That behaviour would suggest buyers are absorbing the available selling pressure.
📌An 8-hour close above the recent swing high near 2.3490, followed by a successful retest, would invalidate the proposed lower-high reversal. Sustained strength through the broader 2.3480–2.3500 area would therefore require reassessing the bearish outlook.
Trade Management: Keep the Risk Defined
📌Any entry should have a stop based on the structure that confirms the trade, with position size adjusted to the stop distance. If price falls sharply before a suitable entry develops, chasing the move would leave less potential reward relative to the risk. Waiting for a fresh setup keeps the decision tied to price action.
LIKE AND COMMENT❤️
THE SETUPSFX_ TEAM
XLM Looks Super Bullish (1H)The price continues to form bullish swings nicely, while buy orders are being collected around the current structure. The recent price action also shows that a liquidity pool has been swept and collected, which can support the continuation of the bullish move if the structure remains intact.
As long as the green zone continues to hold, we expect the price to maintain its bullish structure and gradually move toward the targets marked on the chart. A sustained reaction from this area would keep the current setup valid and could provide further confirmation for the expected move.
As always, proper risk management should not be overlooked. Make sure to manage your position size and risk according to your own trading plan.
A 4-hour candle close below the invalidation level would invalidate this analysis and cancel the current bullish setup.
GBP/USD Rebounds on UK Data, but Bears Remain in ControlThe US dollar rebounded on Thursday thanks to hot producer prices and rising oil, which increased the odds of further Fed hikes. This saw GBP/USD form a decent bearish candle by the day’s close, after printing two small bearish reversal candles beforehand.
UK output data came in slightly hot and has helped GBP/USD rebound from yesterday’s lows. So I am now seeking evidence of a swing high on the intraday timeframes, while retaining a bearish bias as long as GBP/USD remains beneath this week’s high.
Note the monthly pivot point at 1.3548 as a potential resistance level. A break of today’s low and the 590-day RMA could open up a run towards the 1.3475 swing low. A break beneath there brings the 1.3451 high-volume node (HVN) and 200-day EMA into focus, ahead of the monthly pivot just above the 1.340 handle.
MS
SOLUSDT Analyses-42, September 20, 2026
Welcome to my page! I share daily technical analyses of crypto and other charts here.
BINANCE:SOLUSDT
🔍 Market Structure Analysis:
SOL remains bullish on the 1H chart, with higher highs and higher lows supporting the bullish structure.
🎯 Entry & Exit Signal:
Buy Entry: 109.57
Stop Loss: 108.02
Targets: 112.67 R/R:2 - 112.72 - 114.22
Key Support & Resistance:
Key Resistance: 112.72 / 114.22
Key Support Area: 108.02
⚠️Risk Management:
Maximum 1% risk per trade.
❤️Follow me for more: @EhsanZeydabadi
$BTC - Market Update (9/21)CRYPTOCAP:BTC held the 80k level over the weekend, and now we're back at the highs. New week, new plan!
Expecting we bart here at 80k–83k for a while, which should give us a few scalps to play. If we cap around 82.6k–83.3k, I’ll look to swing short back into 79k–78k to fill those imbalances below.
Happy Mondaze! 🦄✨
GBPAUD is in the BullishHello Traders
In This Chart GBPAUD HOURLY Forex Forecast By FOREX PLANET
today GBPAUD analysis 👆
🟢This Chart includes_ (GBPAUD market update)
🟢What is The Next Opportunity on GBPAUD Market
🟢how to Enter to the Valid Entry With Assurance Profit
This CHART is For Trader's that Want to Improve Their Technical Analysis Skills and Their Trading By Understanding How To Analyze The Market Using Multiple Timeframes and Understanding The Bigger Picture on the Charts
GOLD (XAUUSD): Support & Resistance Analysis for Next Week
Here is my latest structure analysis for Gold.
Resistance 1: 4400 - 4442 area
Resistance 2: 4470 - 4510 area
Resistance 3: 4825 - 4886 area
Support 1: 4165 - 4240 area
Support 2: 4103 - 4120 area
Support 3: 3995 - 4027 area
Consider these structures for pullback/breakout trading.
I expect a pullback from Resistance 1.
❤️Please, support my work with like, thank you!❤️
I am part of Trade Nation's Influencer program and receive a monthly fee for using their TradingView charts in my analysis.
$BTC: Back at resistance. Chart analysisBYBIT:BTCUSDT.P
Bitcoin: The asset's growth stopped once again at the historical monthly resistance 📊M-Levels $80200–$82000.
To continue the uptrend, bulls need to hold the weekly support 📊W-Levels $78900–$79900. If this support breaks, the price could once again drop back to the monthly support 📊M-Levels $74500–$76000.
🧩IMA data shows the week ended on a positive note: 🐋large players are massively holding long positions. This points to a possible breakout of resistance and a move up to the $84000–$86000 level.
⚠️If the idea was useful — glad to have your support 🚀.
Analysis based on 🧩IMA (Integrated Market Analysis)
📊M-Levels — Institutional Interest Level (IIL)
Platform restrictions don't allow publishing closed indicators. I only display the result of the 📊Levels algorithm.
CRUDE OIL (WTI): Confirmed Liquidity Sweep?!
I see a potentially valid sell-side liquidity sweep on WTI Crude Oil after a test of a major horizontal key level.
A buying imbalance candle on an hourly time frame confirms that.
We can expect a pullback to 99.06 level.
❤️Please, support my work with like, thank you!❤️
ETHUSD 4H | Bullish Retracement SetupETH has been showing strong bullish structure after breaking out of the consolidation range that held price for several weeks.
On the Daily timeframe, price has broken above the previous range high around $2,550 following a strong move from the $2,360 area. This keeps my overall bias bullish, but I do not want to chase price after such a strong move.
On the 4H, I have marked the latest bullish impulse from approximately $2,361 to $2,663. The Fibonacci retracement gives me the following levels:
38.2% around $2,547
50% around $2,512
61.8% around $2,476
My main area of interest is around $2,440 to $2,480. This area contains the 4H order block, previous structure and is close to the 61.8% Fibonacci retracement.
If price comes back into this area, I will look for confirmation on the lower timeframe rather than entering immediately. Ideally I want to see price react from the zone, followed by a bullish CHoCH and continuation in structure before considering an entry.
My invalidation is below $2,355, as a break below this level would invalidate the structure I am basing the setup on.
The first target would be the recent high around $2,662. If that high is broken with strength, I would then look for continuation opportunities above it.
For now, price is trading around $2,576, so I am happy to wait. The idea is not to chase ETH at current prices, but to wait for price to come back into my area and let the market confirm the setup.
Bias: Bullish
Area of interest: $2,440 to $2,480
Invalidation: Below $2,355
First target: $2,662
Execution: Lower timeframe bullish confirmation
This is the setup I am watching, not a prediction. If price does not return to my area or does not give confirmation, there is no trade.
#ETHUSD #ETH #Ethereum #Crypto #TechnicalAnalysis #PriceAction #MarketStructure
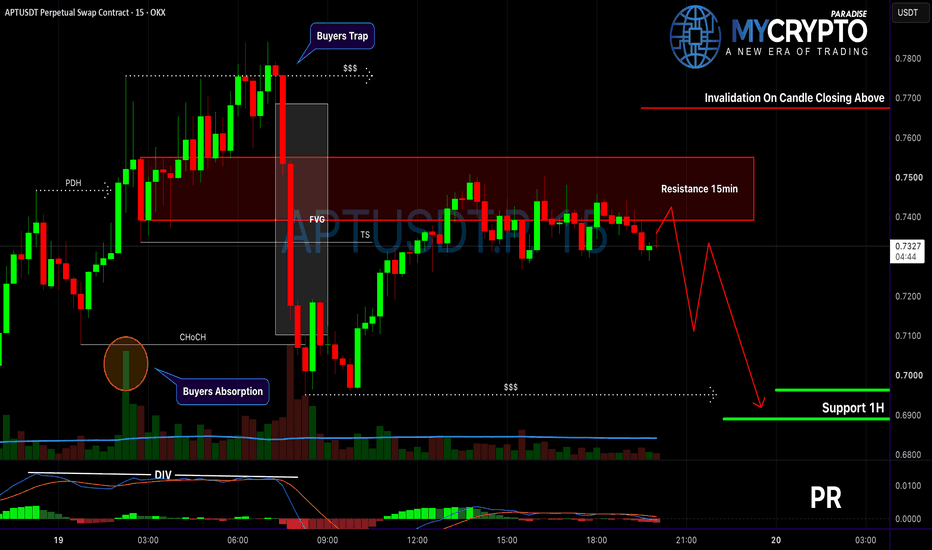
APT Buyers Trapped Again?Yello Paradisers, are #APTUSDT buyers about to get trapped again while price continues struggling directly below a critical intraday resistance zone?
💎#APTUSDT has already shown us an important sequence. Price first pushed above the previous highs around the $0.77 area, attracting breakout buyers and taking liquidity resting above those highs. Instead of continuing higher, that move was aggressively rejected and followed by a sharp sell-off toward $0.70.
💎That rejection is important because it suggests the breakout above the highs acted as a buyers' trap rather than the beginning of a clean bullish expansion.
💎During the sell-off, we also saw strong buying absorption around the lower part of the move, followed by a recovery. However, despite that rebound, APT has so far failed to reclaim the main 15-minute resistance area.
💎Right now, price is consolidating around $0.735 while repeatedly trading underneath the approximately $0.739-$0.755 resistance zone. As long as APT remains below this area, buyers still need to prove they can regain control rather than simply producing another temporary bounce.
💎The current structure therefore keeps a bearish liquidity scenario open. Another rejection from this resistance could send price back toward the liquidity resting around $0.695, with the nearby 1-hour support around $0.689-$0.696 becoming the major area to monitor.
💎At the same time, this scenario has a clear invalidation. A convincing candle close above approximately $0.767 would materially weaken the bearish setup and indicate that buyers are reclaiming the structure instead of being rejected from it.
💎The key here is not predicting every candle. It is waiting for price to confirm which side actually controls this range. APT is sitting directly underneath resistance, while significant liquidity remains below, making patience especially important before committing to either direction.
💎Paradisers, would you expect APT to sweep the liquidity around $0.69 first, or do you think buyers will finally reclaim the resistance and invalidate this bearish scenario?
Strive for consistency, not quick profits. Treat the market as a businessman, not as a gambler. Discipline and patience around these key levels are what separate structured trading from emotional decision-making.
MyCryptoParadise
iFeel the success🌴
UKOIL Sell/Short Setup (15M)Important support levels on Brent crude oil have been lost, and the overall structure has shifted into a bearish phase.
If the price moves back toward the predefined entry zones marked on the chart, we will look for a DCA entry strategy and build the position gradually based on the market reaction. The targets are clearly marked on the chart, and we will monitor the price action closely around those levels.
A break and hit of the stop-loss level will invalidate this setup and cancel the bearish scenario. Proper risk management is essential, and entries should only be taken after the expected reaction from the highlighted zones.
If you have a symbol you want analyzed, first hit the like button and then comment its name so I can review it for you.
Do you think UKOIL is bullish?
XAUUSD: Breakout or Continuation?XAUUSD is still moving inside a clear bearish channel on the H1 timeframe.
At this stage, I’m not necessarily trying to predict the next move. Two scenarios are worth watching.
🔴 Scenario 1 — Bearish continuation
Price could continue lower and revisit the lower boundary of the channel.
The reaction around that area would then become very important to watch.
🟢 Scenario 2 — Retest followed by a bullish breakout
After a possible move back toward the lower part of the channel, XAUUSD could bounce and retest the upper boundary.
A confirmed breakout of this structure could then open the door to a stronger bullish move.
For now, I don’t see any reason to force a trade.
Sometimes, doing nothing is also part of trading.
The market will give us more information as price approaches these key areas.
Which scenario would you choose?
🔴 Bearish continuation?
🟢 Retest and bullish breakout?
Curious to read your views in the comments. 👇
USDCAD BULLISH BREAKOUT? Is the Trend Finally Turning Up? (1H)USDCAD is showing signs of a bullish shift in structure. Price has already collected a significant amount of liquidity, while several key areas have been swept and cleared. We are also seeing the formation of higher lows, which supports the possibility of further upside movement.
If the green zone continues to hold and buyers step in from this area, USDCAD could continue moving higher toward the projected targets marked on the chart.
The green zone is therefore an important area to monitor for a potential Buy/Long opportunity. As long as the bullish structure remains intact, the upside targets remain valid.
However, risk management remains essential. A daily candle close below the invalidation level would invalidate this analysis and the bullish scenario should no longer be considered valid.
If you have a symbol you want analyzed, first hit the like button and then comment its name so I can review it for you.
Do you also think USDCAD is bearish?
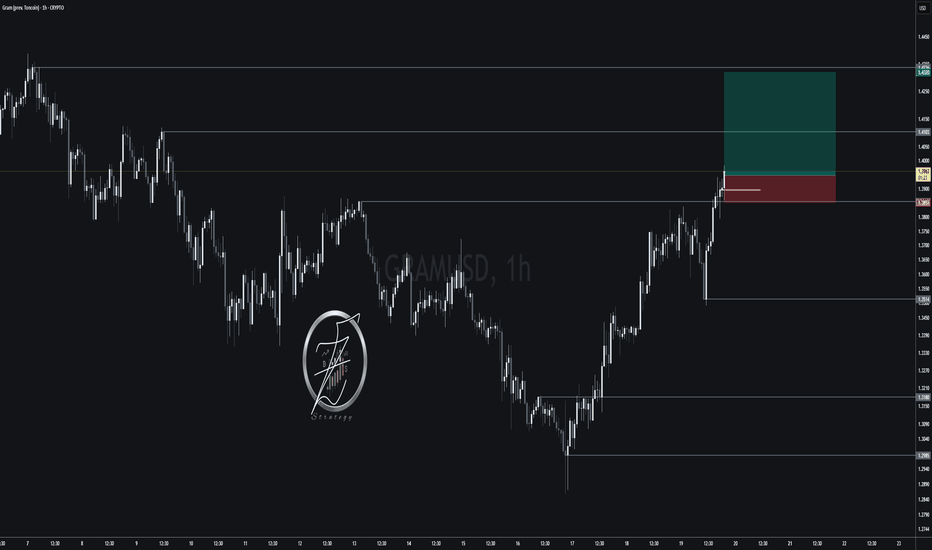
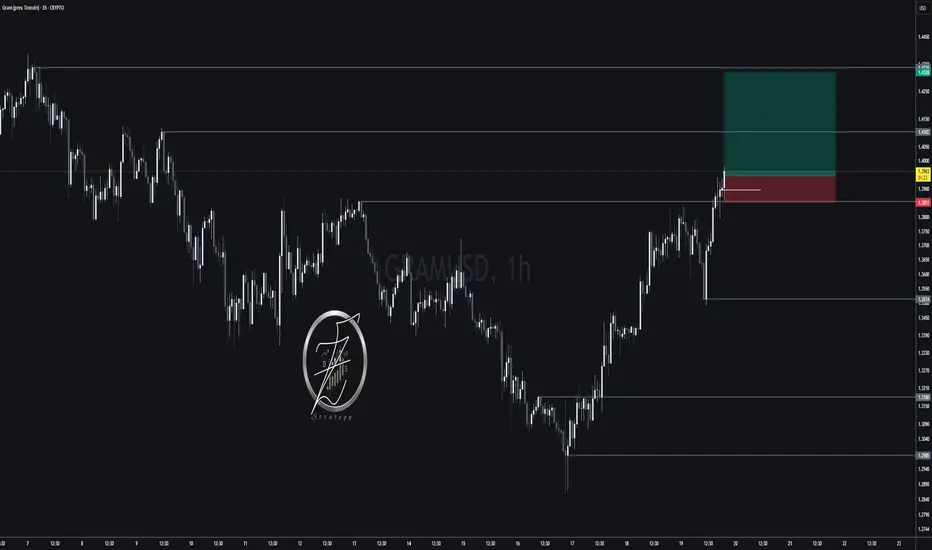
GRAMUSD Analyses-41, September 19, 2026
Welcome to my page! I share daily technical analyses of crypto and other charts here.
CRYPTO:GRAMUSD
🔍 Market Structure Analysis:
GRAM is bullish on the 1H chart, with higher highs and higher lows forming after the previous bottom.
🎯 Entry & Exit Signal:
Buy Entry: 1.3950
Stop Loss: 1.3851
Targets: 1.4148 R/R:2 - 1.4103 - 1.4320
Key Support & Resistance:
Key Resistance: 1.4103 / 1.4320
Key Support Area: 1.3851 / 1.3514 / 1.3180 / 1.2985
⚠️Risk Management:
Maximum 1% risk per trade.
❤️Follow me for more: @EhsanZeydabadi
BAT/USDT 8H — SPOT Accumulation & Rebalance Idea
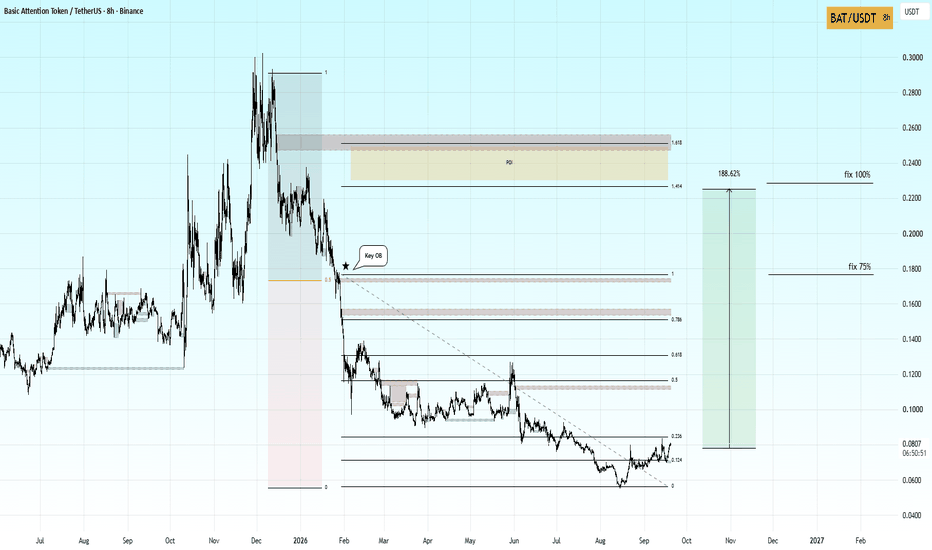
BAT/USDT 8H — SPOT Accumulation & Rebalance Idea (+188% Potential)
BAT has formed a key imbalance during the previous bearish expansion. Price is currently trading near the lower boundary of the range, where the first signs of stabilization and accumulation are appearing.
In the medium term, I expect this imbalance to be rebalanced. The main targets are:
• Target 1 — Fibonacci level 1, around $0.177
• Target 2 — Fibonacci level 1.414, around $0.226
My profit-taking plan:
• Take 75% at level 1
• Take the remaining 25% at level 1.414
The potential from the current area is approximately 188%.
This is a SPOT idea only — no leverage. Always use proper risk management and do your own research.
$CHZ: Trade plan LongBYBIT:CHZUSDT.P
Market sentiment is bullish. Upside breakout from resistance is very likely.
Quick trade setup.
Entry on a pullback to weekly support 📊W-Levels. Reduced position size — trading right at monthly resistance.
🧩IMA data: 🐋large players are holding long positions, US session was adding.
🟡 Trade plan (Long)
🟢 1. Entry: $0.01452
🟢 2. Entry: $0.01514
🛑 Stop: $0.01268
🎯 Target: $0.01935
⚠️If the idea was useful — glad to have your support 🚀.
Analysis based on 🧩IMA (Integrated Market Analysis)
📊M-Levels — Institutional Interest Level (IIL)
Platform restrictions don't allow publishing closed indicators. I only display the result of the 📊Levels algorithm.
AUDCAD -- BullishAUDCAD — Bullish
Price confirmed the trend by breaking the LTF external LH.
From there, I saw bullish continuation and missed a couple buy points, but still followed the trend.
Now waiting for price to return to the black zone — my LTF continuation spot. If the LTF low gets swept, that's a ticket for me to join the train.
Price already showed its hand by mitigating the previous green zone and reacting from it. Signs of holding so far.
Now we wait.
Patience is key.
Tracking remains the edge.
Let’s go. 🧃
EURUSD - HTF BullishEURUSD — HTF Bullish
HTF bullish.
Price gave a deep midterm pullback, sweeping multiple liquidity legs and taking out the inducement, confirming the high and engineering liquidity into a lower-timeframe minor auction zone.
At the same time, price is mitigating the HTF daily order-flow area highlighted in purple.
HTF structure remains intact. Price also gave HTF candle acceptance, while the midterm lower high has been broken, giving us the pullback correction I was looking for.
Now waiting for the LTF shift — break of the lower high — to confirm the change in structure and give continuation points.
This week, I’m simply waiting for price to open up and show its hand.
Until then, patience is key.
Tracking remains the edge.
Let’s go. 🧃
EURGBP - HTF BullishEURGBP — HTF Bearish
Price been creepy crawling towards the premium area while bullish footprints remain present, climbing into the sell area.
I’m waiting for bullish continuation. Price confirmed the internal minor structure high by sweeping liquidity.
Now waiting for full mitigation into the minor auction zone.
Until then, patience is key.
Tracking remains the edge.
Let’s go. 🧃