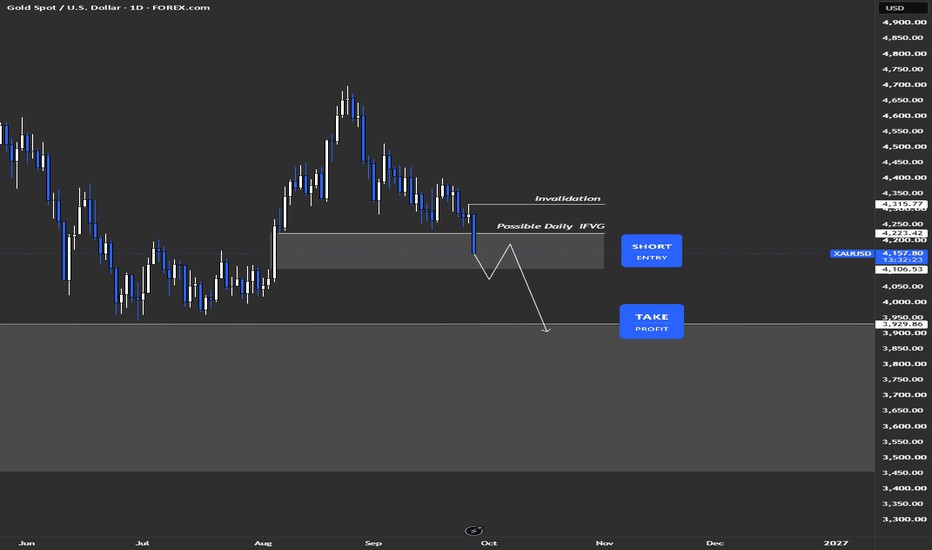
Gold/Xau - Strong Monthly Draw Setting up A+ SetupFour things line up on gold: bearish HTF structure, a weak bottom, a clear draw on liquidity, and the timing.
1. HTF Structure Is Bearish
Since the monthly top, gold has printed lower high after lower high.
Every rally has been sold. August tried to push higher and failed. September is giving it back.
As long as that holds, I only look for shorts.
2. A Weak Bottom
The recent monthly lows sit almost perfectly level.
Barely any wicks below them. No real rejection.
Equal lows like these
Stochastic Oscillator
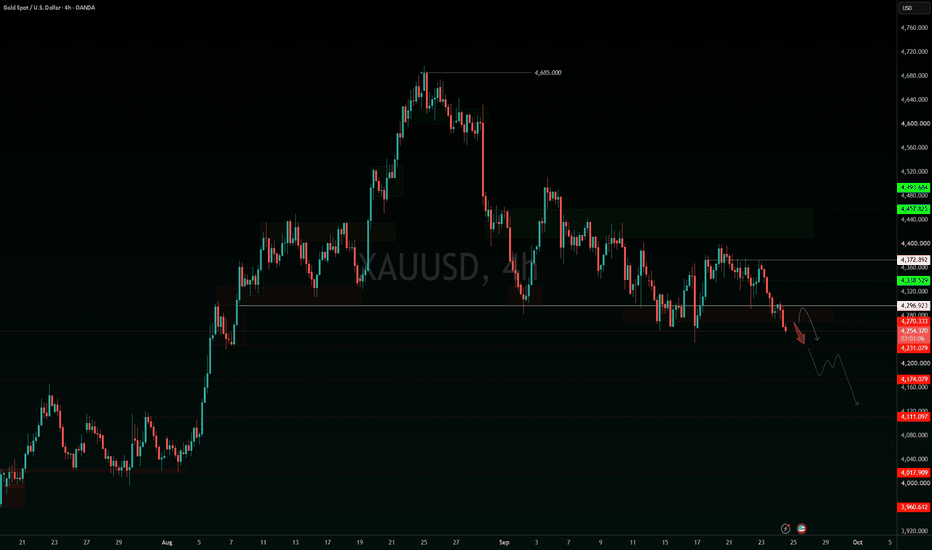
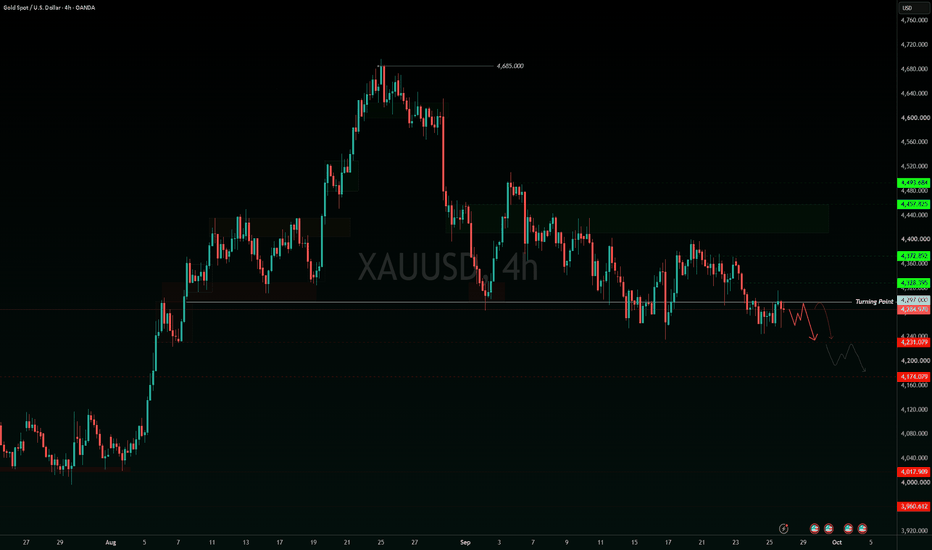
GOLD: Below 4297 as Iran Uncertainty and High Yields
Gold faces a difficult mix of geopolitical uncertainty and elevated U.S. Treasury yields. President Trump has rejected Iran’s proposed plan for reopening the Strait of Hormuz, leaving the diplomatic outcome uncertain. The U.S. 10-year Treasury yield also ended September 25 above 5.10%, adding pressure to non-yielding gold.
Technically, 4297 is the deciding level. While GOLD remains below it, my primary scenario is a move toward 4231. A sustained break below 4231 would bring 4174 into focus, wi
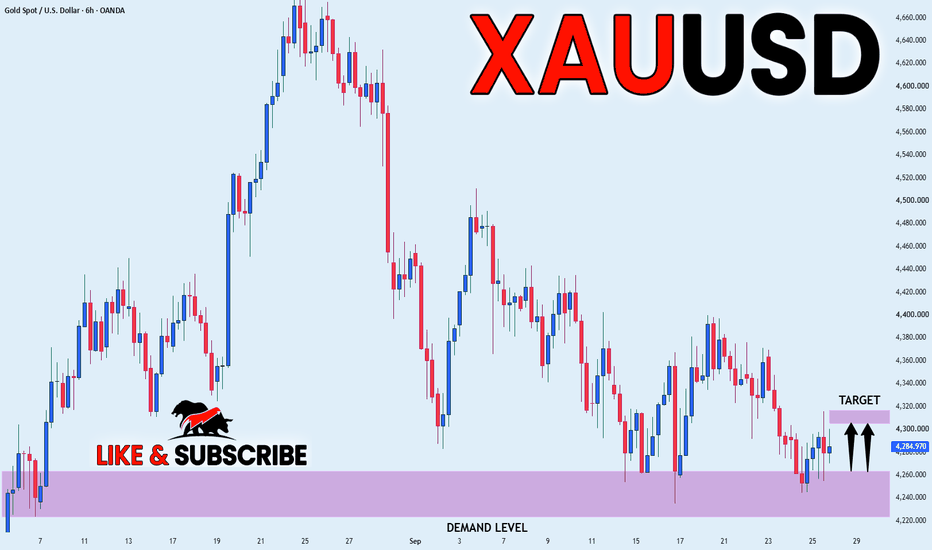
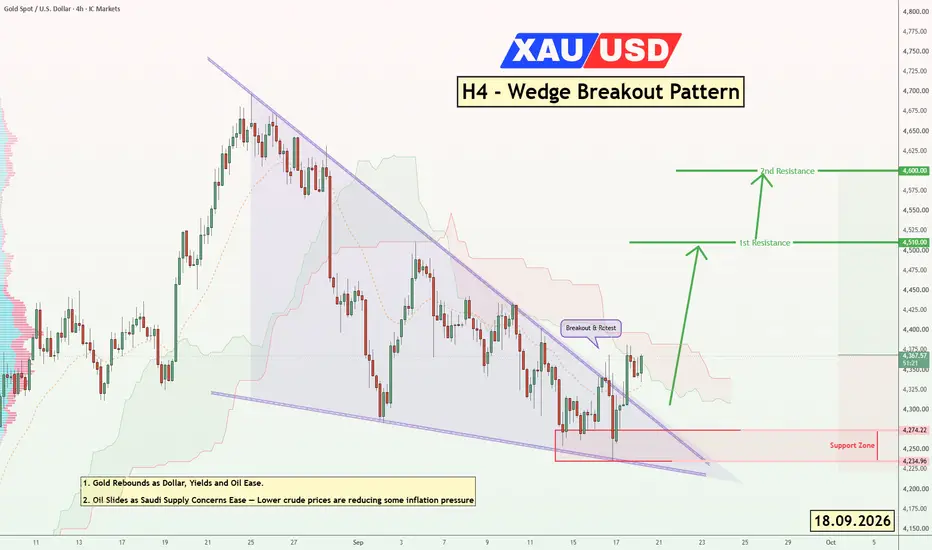
XAU/USD: Fed, Yields and Oil Shape Next Move 4,600 ?Gold is attempting to confirm a bullish breakout from the descending wedge, with price holding above the breakout and retest area. As long as the 4274.22–4234.96 support zone remains protected, the structure keeps room toward the 4510 and 4600 resistance levels.
🟢1st Resistance : 4510
🟢2nd Resistance : 4600
🔴Support Zone : 4274.22 – 4234.96
📰 Fundamentals and Live Headlines :
1. Gold Rebounds as Dollar, Yields and Oil Ease.
2. Oil Slides as Saudi Supply Concerns Ease — Lower crude prices are
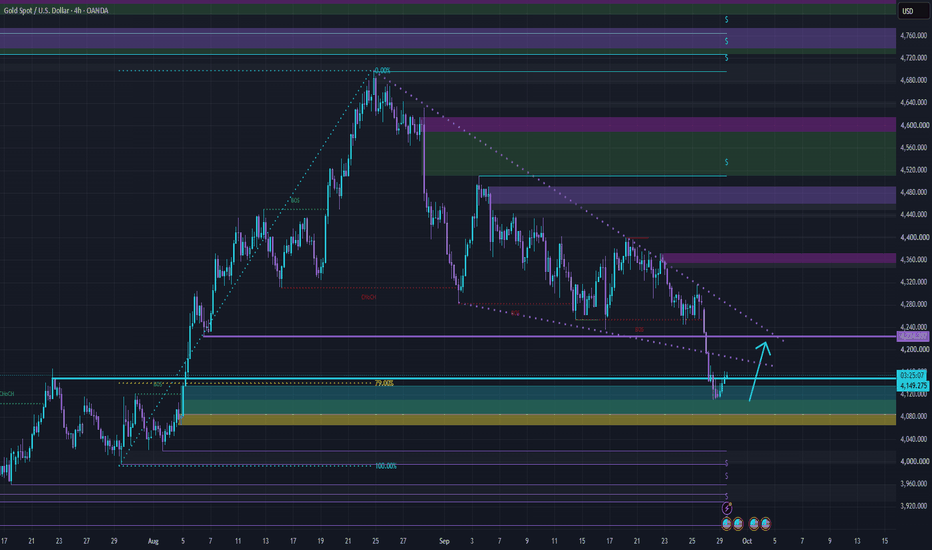
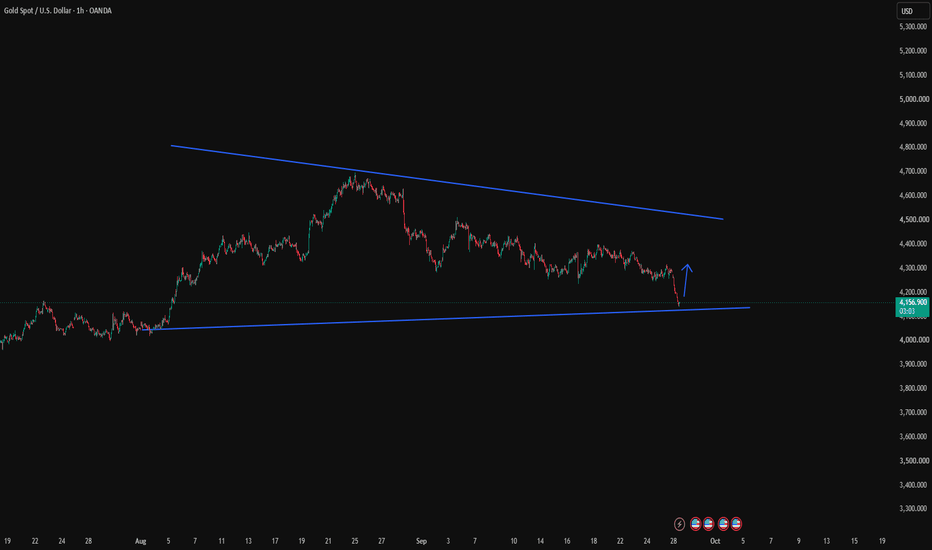
Gold Testing Key Support: Breakout or Fakeout?Gold ( OANDA:XAUUSD ) has retraced right back into a major support zone (around the 78.6% Fibonacci level / $4,150 key level).
Price is tightly compressing against the descending trendline. The cyan arrow points to a critical breakout zone.
👇 What is your move here?
• 🟢 BUY: Clean breakout above the trendline.
• 🔴 SELL: Rejection at the trendline/trend continues lower.
• 🟡 WAIT: Need more volume confirmation.
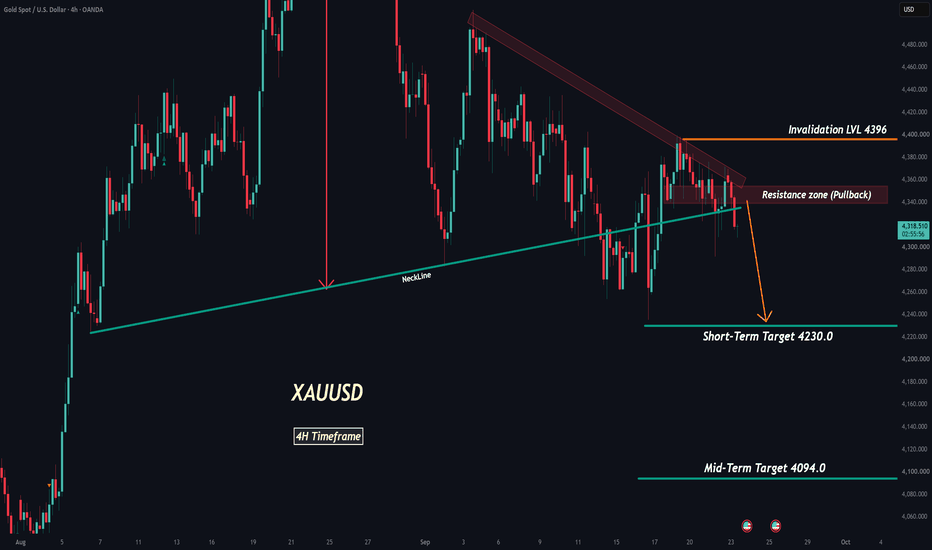
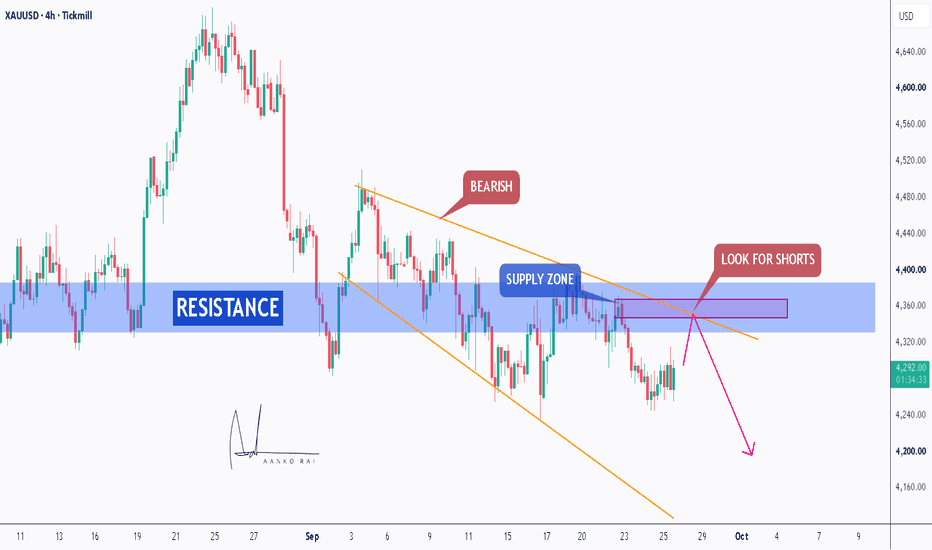
Gold XAUUSD 4H: Rejection Could Send Price Toward $4,230XAUUSD remains bearish on the 4H timeframe
Price is currently testing the marked pullback/resistance zone, and the downside move is still more likely as long as this area continues to reject price.
The setup is simple: sell from the current area or slightly higher after a clear rejection, with very low risk and a defined invalidation.
Setup: Short after rejection from the pullback/resistance zone
Invalidation: $4,396
Short-Term Target: $4,230
Main Target: $4,094
The first target at
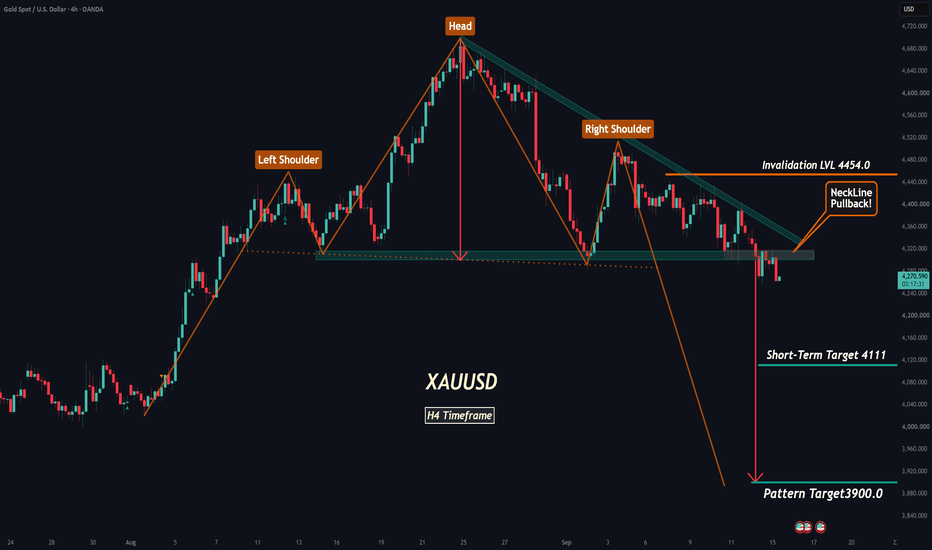
XAUUSD: Gold H4 Head & Shoulders Has Broken XAUUSD: Gold H4 Head & Shoulders Has Broken
A Head & Shoulders pattern has formed on the H4 Gold chart, and the neckline has now been broken.
This is an important structural development.
The neckline break gives us a clearer bearish direction for the higher timeframe, but I would not treat this as a simple short-term entry signal.
For me, this setup is more valuable as a directional guide for Day Trading.
Instead of blindly selling after the neckline break, I would rather use the bearis
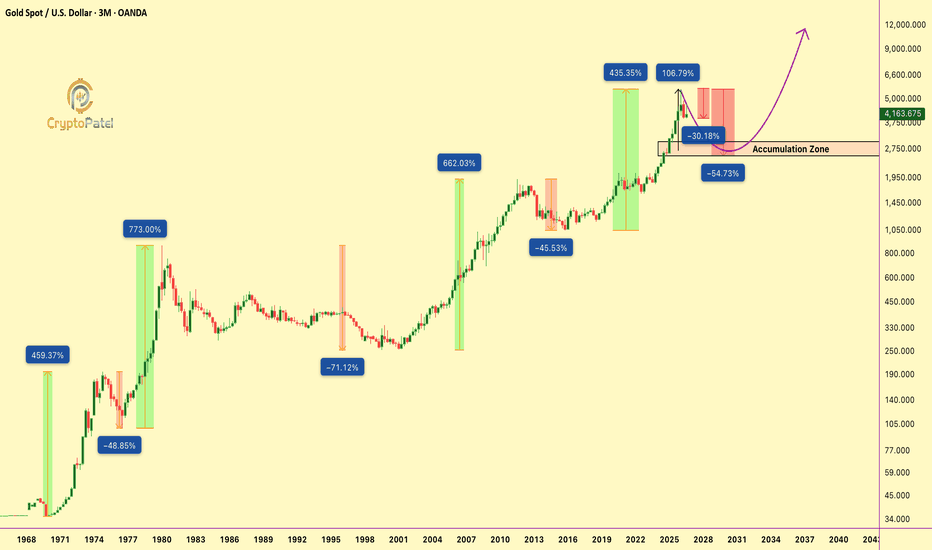
GOLD $XAU: THE FRACTAL IS STILL PLAYING OUT EXACTLY AS EXPECTED.GOLD TVC:XAU : THE FRACTAL IS STILL PLAYING OUT EXACTLY AS EXPECTED.
On March 20, I mapped the macro path:
→ Massive Rally
→ 45–70% Correction
→ Accumulation
→ Bigger Rally
Then I called the $3,900 → $4,700 relief rally BEFORE the move.
TVC:XAU hit ~$4,700, exactly into the bearish order block I highlighted, and the rejection is now playing out.
Gold has since dumped from ~$4,700 → ~$4,140.
NEXT MACRO TARGETS: $3,800/$3,400/$3,200
That would represent roughly:
➔ ~42% downside from ATH
➔
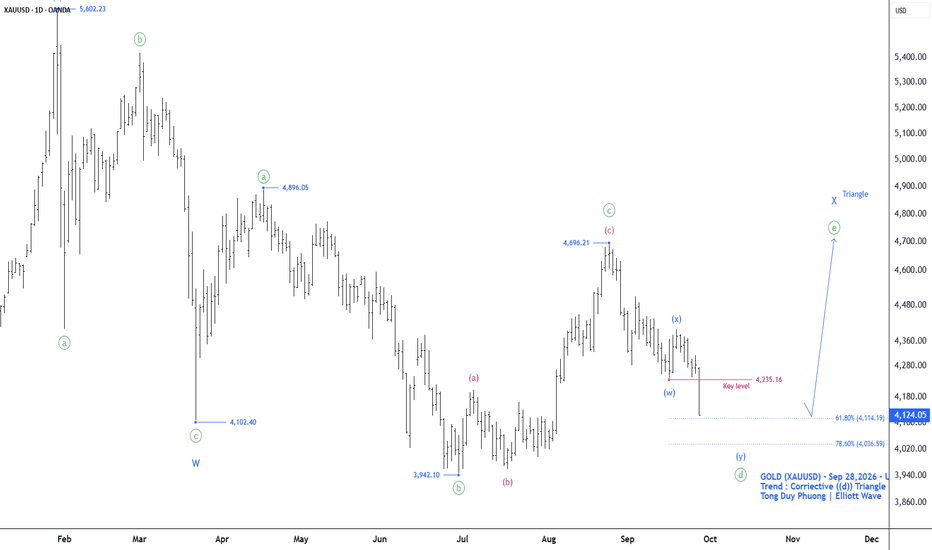
Gold Is Still Trapped in a Bearish Structure (1H)On gold, it appears that we are forming a triple combination corrective structure. The minimum targets for wave Z are already marked on the chart.
Looking at the bigger picture, we can see two X waves and three corrective patterns within this structure. The current wave structure on gold is still corrective, and the expectation is that price may continue moving lower to complete the final X wave low before a potential change in structure.
At the moment, bearish momentum is stronger than bullis
Yields Squeezing, Dollar Running, and What It Means for GoldIf you look at the charts right now, a major technical and macroeconomic setup is unfolding across Treasury Yields, the US Dollar Index TVC:DXY , and Gold.
1. Weekly Squeeze on 10 Year Yields
The weekly chart for TVC:TNX shows price action is coiling tightly into the apex of a multi year pennant pattern. The moving averages (red and green lines) are stacked underneath price, curling upward, and providing dynamic support. At the same time, weekly momentum indicators like the TTM Squeeze are t
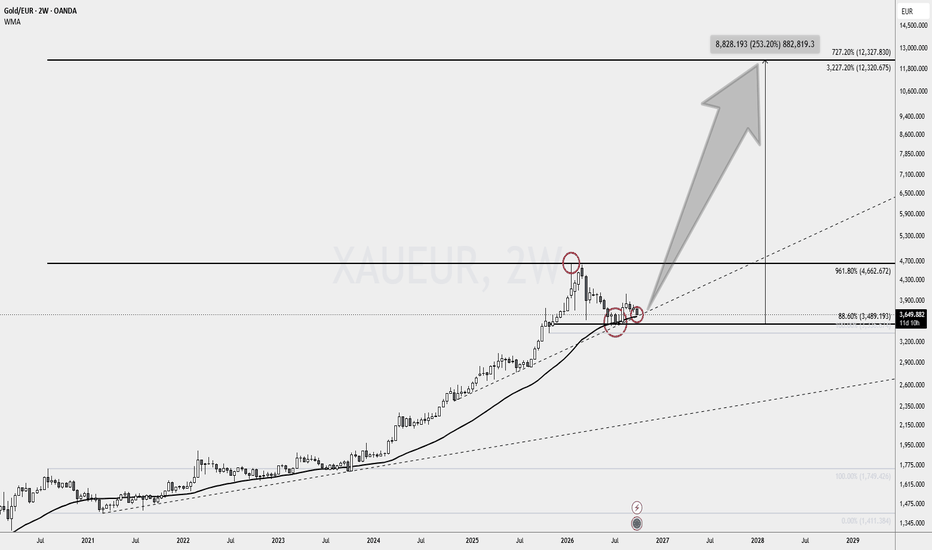
XAU/EUR TO €12,300? The fundamentals behind a +250% potentialI’m watching an ambitious long-term scenario in gold priced in euros. Its foundation is a combination of growing demand for gold, Europe’s exposure to expensive energy, and the possibility of a weaker euro.
XAU/EUR tells us how many euros one ounce of gold costs. It can rise because gold becomes more valuable globally, because the euro weakens, or because both happen together.
Here is what makes this scenario worth following.
🏦 Central banks are putting real money behind gold
The World Gold
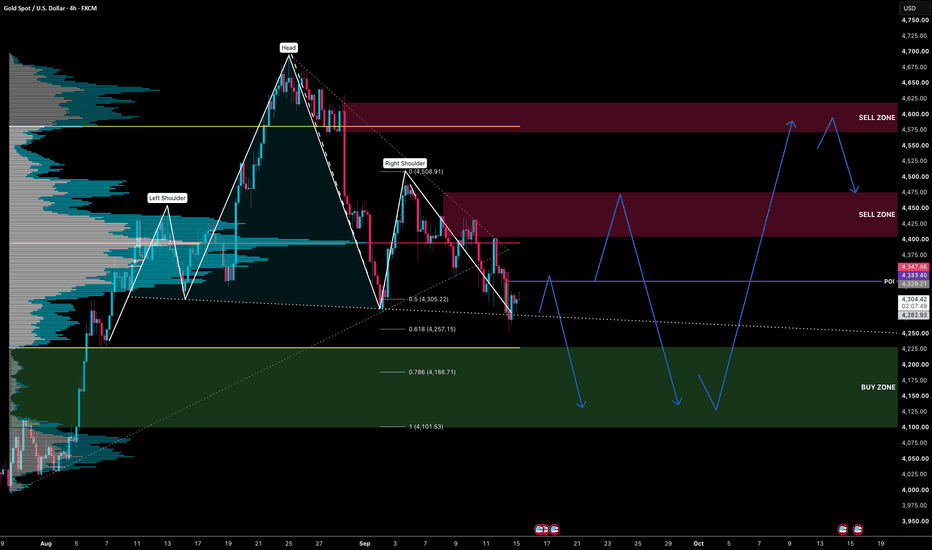
XAUUSD 4h (FXCM) — Head & Shoulders pressing the necklineStructure. A completed head-and-shoulders top: left shoulder ~4,440, head ~4,700, right shoulder 4,508.91 (fib 0). The neckline (white dotted) runs from the 4,290 trough between the left shoulder and the head, through the 4,305 trough after the head, and slopes gently down to ~4,255 at the right edge. Price is at 4,310 with 2h21m left on the candle: the last two bars wicked through the neckline to ~4,255 and closed back above it. So far it is a pierce, not a break. Two further bearish items sit
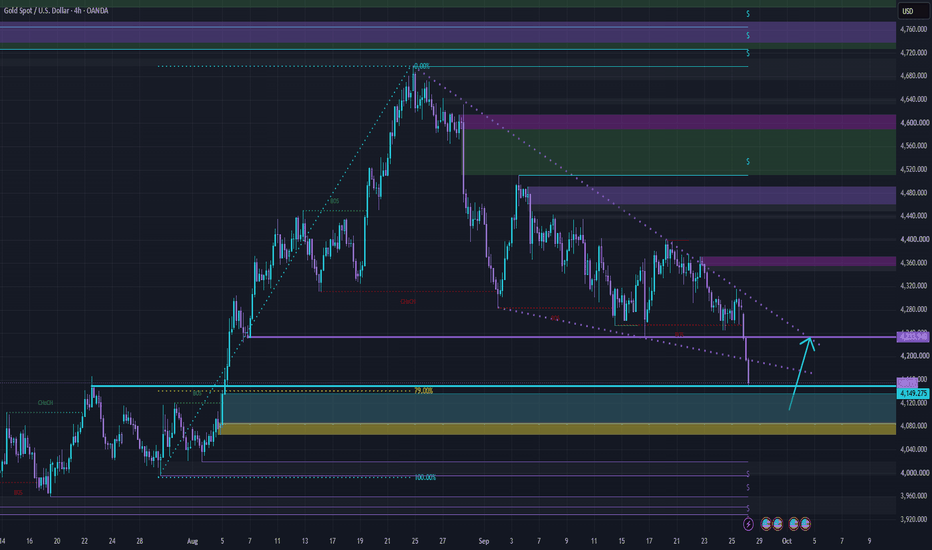
GOLD JUST BROKE DOWN: NEW CHART UPDATE The support has snapped. 📉Gold has officially broken below the key $4,233 level we were watching, plunging straight down into the $4,149 support zone.
What's your next move?
1️⃣ Shorting the retest at $4,233 🐻
2️⃣ Buying the bounce here at $4,149 🐂
3️⃣ Staying on the sidelines 🍿Drop your predictions below! 👇
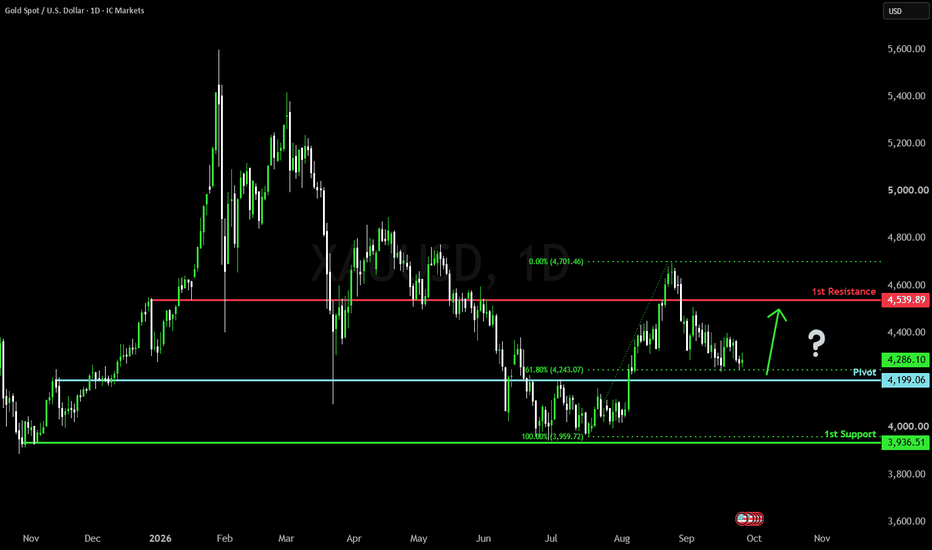
Bullish bounce at key support?Gold (XAU/USD) is falling towards the pivot, which is an overlap support, which is near the 61.8% Fibonacci retracement, and could bounce towards the 1st resistance, which is an overlap resistance.
Pivot: 4,199.06
1st Support: 3,936.51
1st Resistance: 4,539.89
Disclaimer:
The opinions given above constitute general market commentary and do not constitute the opinion or advice of IC Markets or any form of personal or investment advice.
Any opinions, news, research, analyses, prices, other in
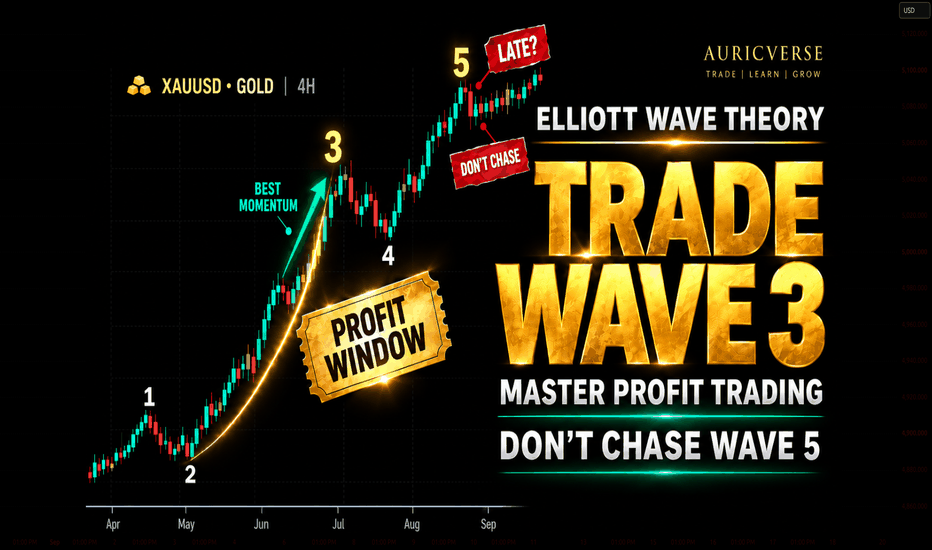
Elliott Wave Theory - Master Profit TradingElliott Wave Theory helps traders read a trend as a sequence of five waves rather than a random collection of candles. Waves 1, 3 and 5 move with the main trend, while Waves 2 and 4 are corrective phases.
The real value is not simply counting waves — it is understanding where momentum may still have room to expand and where the move may already be late.
1. Why Wave 3 Matters
Wave 1 often begins before most traders fully trust the new direction. Wave 2 then pulls price back and creates doubt
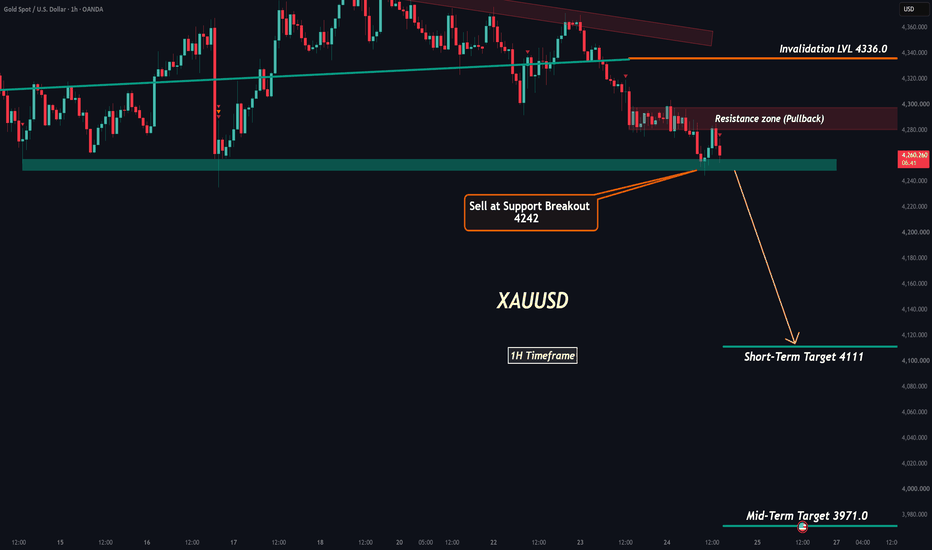
Gold XAUUSD : Bearish Continuation — 4,242 Support Is the KeySetup: Add to Short with very small risk.
Previous short positions are already risk-free.
Confirmation: A clean break below 4,242 would confirm the bearish continuation.
Mid-Term Target: 4,094, located around a major support area.
XAUUSD is still showing signs of bearish continuation.
Our previous sell positions remain open and have already been moved to risk-free.
Based on the latest price action, we are carefully adding to the sell position with very small risk.
The bearish move is not
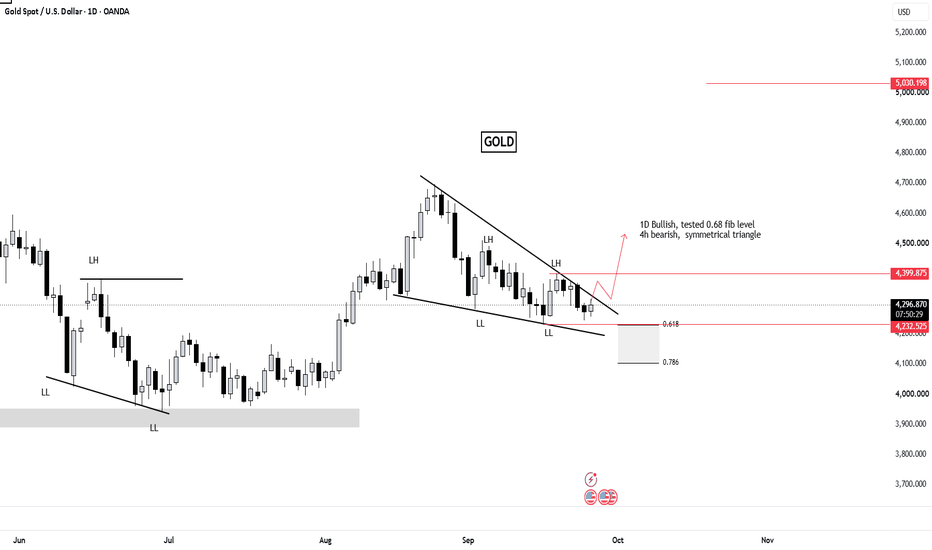
Gold next move to break all time high
1D bullish trend making higher highs and higher lows
Symmetrical triangle is forming
Potential breakout toward a new all-time high
Triangle projection around $5,000
4H is still bearish
Waiting for 4H confirmation before entry
Manage your risk first
#Gold #XAUUSD #TechnicalAnalysis #PriceAction #SymmetricalTriangle #Bullish #Forex #TradingView #GoldTrading #AllTimeHigh
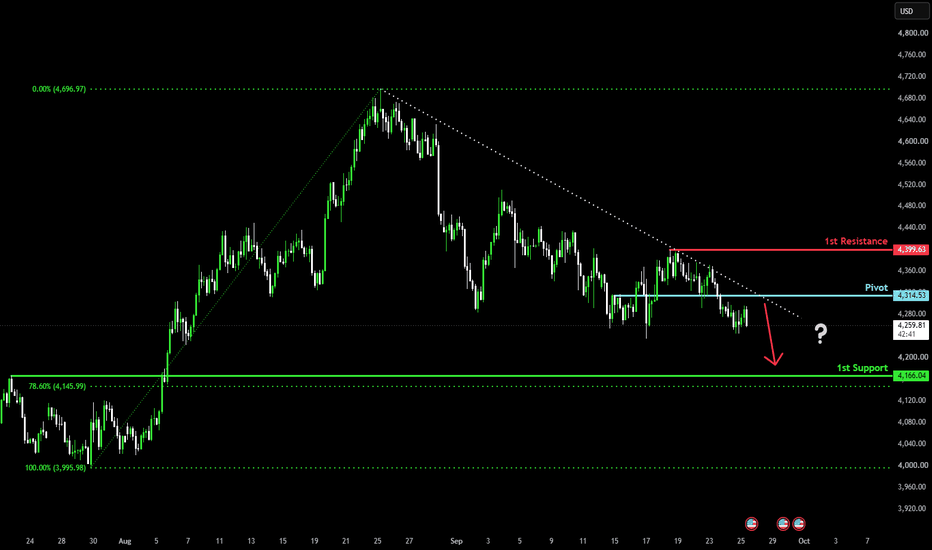
Bearish momentum to continue?Gold (XAU/USD) is rising towards the pivot and could reverse towards the 78.6% Fibonacci support.
Pivot: 4,314.53
1st Support: 4,166.04
1st Resistance: 4,399.63
Disclaimer:
The opinions given above constitute general market commentary and do not constitute the opinion or advice of IC Markets or any form of personal or investment advice.
Any opinions, news, research, analyses, prices, other information, or links to third-party sites contained on this website are provided on an "as-is" basis,
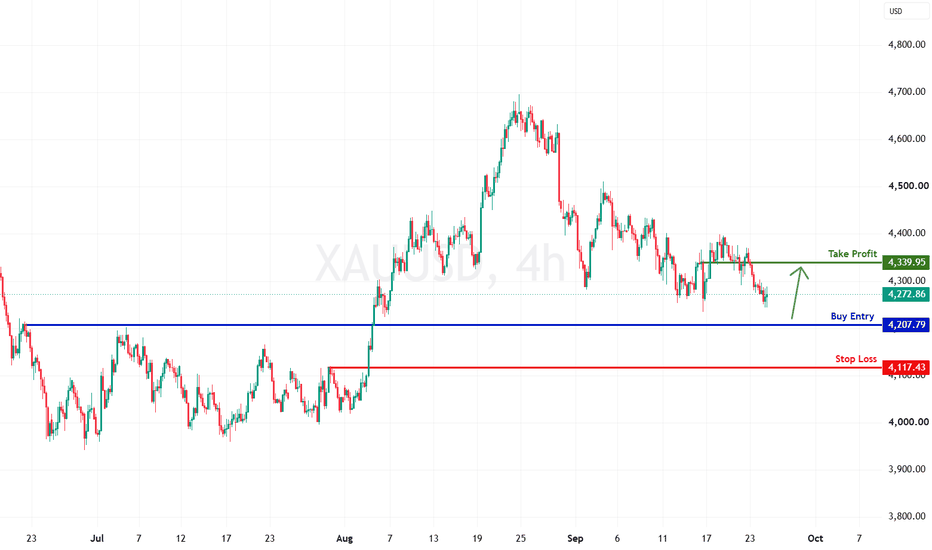
Gold H4 | Bullish Bounce Off Pullback SupportBased on the H4 chart analysis, we could see the price falling to our buy entry level at 4,207.79, which is a pullback support.
Our stop loss is set at 117.43, which is a pullback support.
Our take profit is set at 4,339.95, which is a pullback resistance.
High Risk Investment Warning
65% of retail investor accounts lose money when trading CFDs with this provider. You should consider whether you understand how CFDs work and whether you can afford to take the high risk of losing your money.
GOLD | Bears Eye 4231 as Oil & Treasury Yields Rise
Gold continues to trade under strong bearish pressure and has perfectly reached our previous downside projection after falling from the 4338 area.
Fundamentally, the pressure is being reinforced by rising oil prices, elevated U.S. Treasury yields and expectations of further Fed tightening. Oil gained sharply as U.S.–Iran diplomacy showed little concrete progress, while the U.S. 10-year yield remains near its highest level since 2007. This combination keeps inflation expectations elevated and