Supply and Demand
BTCUSDBTCUSD | Waiting for the Retest Before Continuation
Bitcoin has pushed into a key confluence zone where descending resistance meets the broader ascending channel. Rather than chasing the breakout, I'm watching for a controlled pullback into this level. If resistance flips into support and buyers' step back in, it could provide a high-probability continuation setup toward the upper boundary of the channel. Patience is key here—the best trades often come after confirmation, not anticipation. As always, risk management comes first.
My probability assessment:
🟢 Bullish continuation: 65–70%, provided the retest holds.
🔴 Bearish rejection: 30–35%, if sellers force a daily close back below the reclaimed trendline.
Overall, your projected path is technically sound because it waits for confirmation instead of assuming the breakout will continue immediately. The next few daily candles should determine whether Bitcoin is preparing for another leg higher or setting up a false breakout.
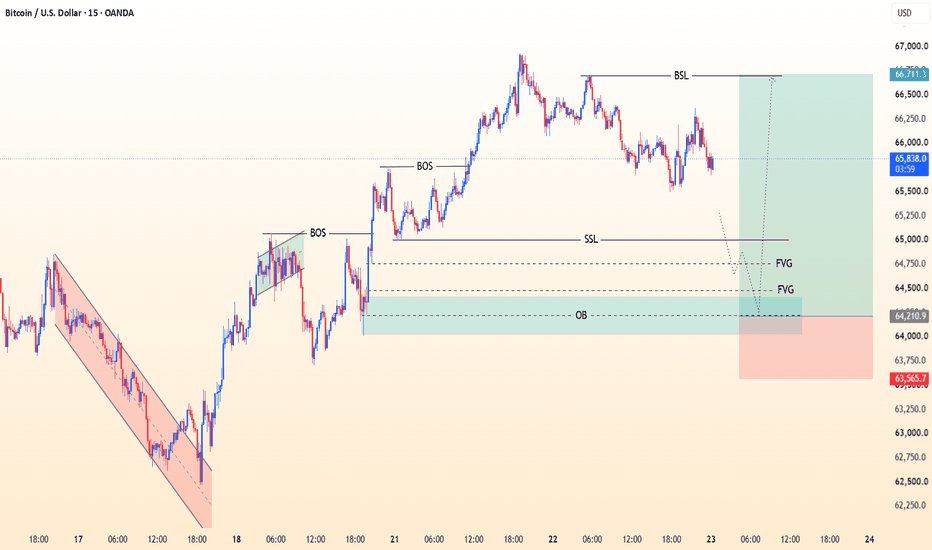
BTC/USD Bullish Setup – Buying the Order Block Disclaimer:
This is not financial advice. This idea is shared for educational purposes only. Always do your own research and trade at your own risk.
Analysis:
Bitcoin is currently showing a bullish market structure with higher highs and higher lows. We have a clear Bullish Order Block (OB) in the 64,000 – 64,300 zone. Price is expected to sweep the Sell Side Liquidity around 65,000 before reversing and bouncing strongly from our demand zone.
Entry Plan: Buy Zone: 64,000 – 64,300
Reason: Bullish Order Block + Strong Market Structure
Target 1: 65,000 (Liquidity Grab)
Target 2: 66,000 – 66,500
Invalidation: Break and close below 63,500
This setup offers a high-probability long opportunity if price reaches the bullish OB and shows reversal confirmation.
#Bitcoin #BTC #BTCUSD #Crypto #CryptoTrading #OrderBlock #BullishSetup #BitcoinAnalysis
NZDUSD new downswing upcoming ??Overall structure:
Broadly the structure is bearish as price is forming lower highs and lower low, and had got multiple rejections form the major bearish trendline, on the other hand we can see a bullish trendline intact, supporting up-moves and continuously making higher lows.
Current situation:
After a big decline when price was showing a corrective rally it has started to face rejections from the level of 0.5872 which is currently acting as strong resistance & it seems like the pullback is over now and it's likely to reverse back in the lower direction, and continue its down-move, if current consolidation gives a breakout in the bearish direction then, we'll have a good opportunity to take fresh short entry and can target the level of 0.5655.
Immediate resistance is at 0.5872 & the breakout level of the consolidations is at 0.5801
Outlook remain on the bearish to sideways direction, only sell trades should be preferred at resistance levels.
For Educational Purposes only, Not an Investment Advice, Always use strict Risk management measures.
Regards CrazyTrades247.
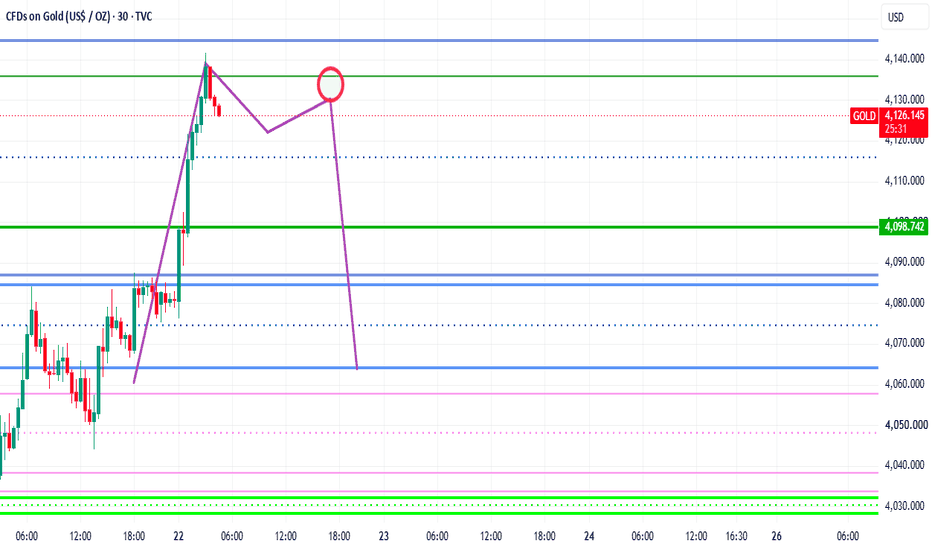
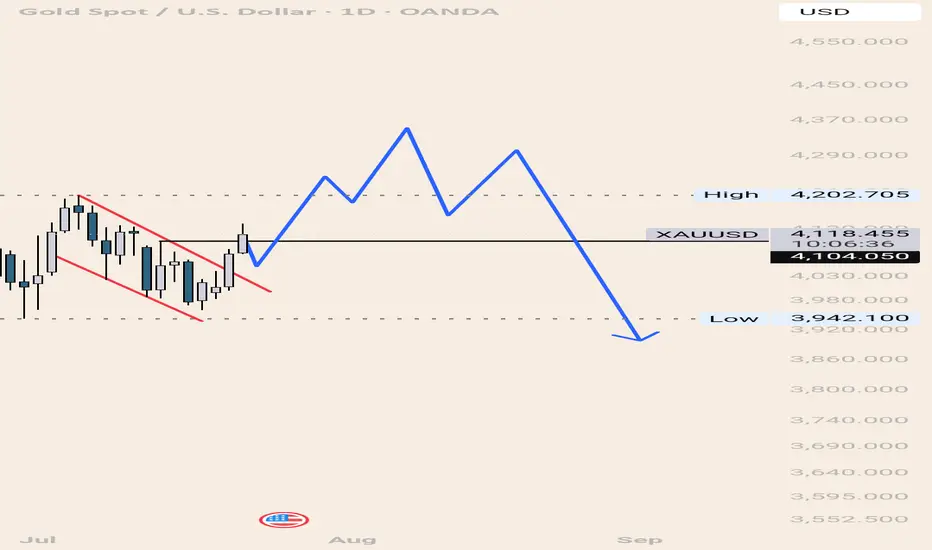
XAUUSD Roadmap: The Road to 4350 and the Long-Term ReversalGold Update
After breaking 4104 and holding above it with an 8-hour candle:
Gold targets 4243 first.
Then 4350 as a final and highly important level.
After that, I see it resuming its decline below 4000.
As shown by the blue line.
Note: This is on the daily timeframe, meaning it will take a long time for this scenario to play out.
ZEN at macro floor: base recovery toward $5.005The Macro Picture 🗺️
ZEN slid the whole way from the $7.50 top down toward the $3.828 macro floor and has flattened into a base just above it at $4.165. The months of lower lows have given way to a tight sideways grind — exhaustion rather than continuation.
The Setup ⚙️
The Accumulation Zone 🟢
$3.828–3.922 is where the selling has dried up. Macro Support has held on retest, with the $3.922 Local Low as the nearer shelf — this is the demand base a recovery would build from.
The Decision Point 🔴
$6.998 (Local High) is the structural gate. Before it, the $5.005 measured-move target is the first objective — reclaiming it proves buyers are stepping back in.
The Roadmap 🛣️
Hold the $3.828 floor → recover toward $5.005 → then challenge $6.998. Invalidation is a clean daily close below $3.828 — that voids the accumulation thesis.
This is a textbook DCA Accumulation Zone setup: scale in across the $3.828–3.922 band and let the base do the work.
More setups in profile.
#ZEN #Horizen #crypto #trading #TA #3Commas #DCA
MANTA: local squeeze with $0.0857 destinationThe Macro Picture 🗺️
MANTA has been rotating in a range, and after a dip toward the lows it has reclaimed ground to $0.06420, holding above the $0.05911 local-low shelf. Price is coiling in the lower half of the band as it sets up the next move.
The Setup ⚙️
The Range Floor 🟢
$0.05435 (Macro Support) is the demand base, with $0.05911 (Local Low) as the nearer shelf. Both have held, and that's the floor this range pivots on.
The Decision Point 🔴
$0.07278 (Local High) is the gate. A daily close above it flips the local structure bullish and opens the path to the $0.08572 measured-move target.
The Roadmap 🛣️
Hold above $0.05911 → break $0.07278 → run toward $0.08572. Invalidation is a clean daily close below $0.05435 — that breaks the range.
This is a GRID Range Play: a defined band to rotate, buying the lower half and scaling out into the breakout.
More setups in profile.
#MANTA #MantaNetwork #crypto #trading #TA #3Commas #GRID
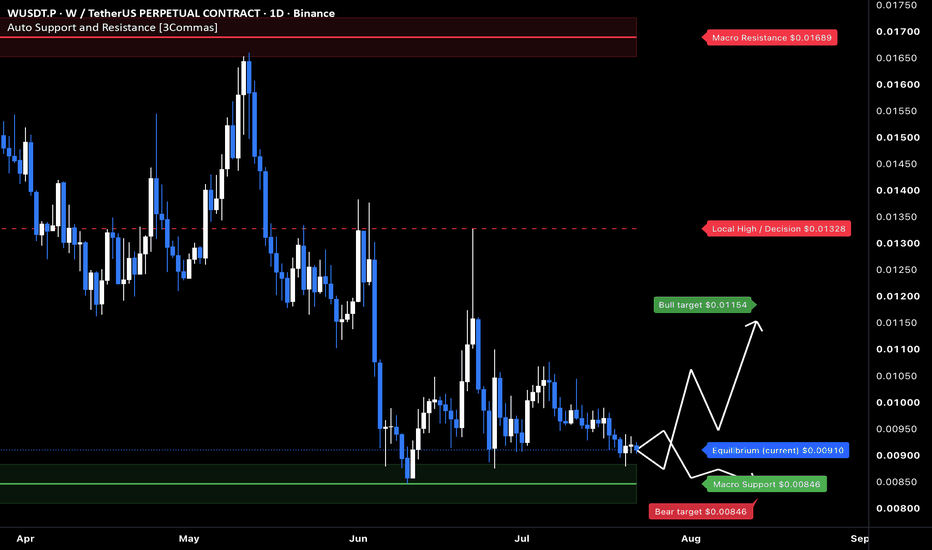
W at macro floor: base recovery toward $0.0116The Macro Picture 🗺️
W unwound from the $0.0165 highs down to the $0.00846 macro floor and has flattened into a base just above it at $0.00913. The steep selling has given way to a sideways grind — exhaustion rather than continuation.
The Setup ⚙️
The Accumulation Zone 🟢
$0.00846–0.00913 is where the selling has dried up. The macro floor has held on retest, and this is the demand shelf a recovery would build from.
The Decision Point 🔴
$0.01328 (Local High) is the structural gate. Before it, the $0.01157 measured-move target is the first objective — reclaiming it proves buyers are stepping back in.
The Roadmap 🛣️
Hold the $0.00846 floor → recover toward $0.01157 → then challenge $0.01328. Invalidation is a clean daily close below $0.00846 — that voids the accumulation thesis.
This is a textbook DCA Accumulation Zone setup: scale in across the $0.00846–0.00913 band and let the base do the work.
More setups in profile.
#W #Wormhole #crypto #trading #TA #3Commas #DCA
YFI: local squeeze with $2681 destinationThe Macro Picture 🗺️
YFI flushed down to the $1675 low in late June, then snapped back hard to $2139 in a sharp recovery. Price is now consolidating in the middle of the range, digesting the bounce as it decides its next leg.
The Setup ⚙️
The Range Floor 🟢
$1579 (Macro Support) is the demand base, with $1675 (Local Low) as the nearer shelf. Both were defended on the flush, and that's the floor this range pivots on.
The Decision Point 🔴
$2819 (Local High) is the structural gate. Before it, the $2681 measured-move target is the first objective — reclaiming it keeps the recovery intact.
The Roadmap 🛣️
Hold above $1675 → rotate up toward $2681 → then challenge $2819. Invalidation is a clean daily close below $1579 — that breaks the base.
This is a GRID Range Play: a defined band to rotate, buying the lower half and scaling out into strength.
More setups in profile.
#YFI #YearnFinance #crypto #trading #TA #3Commas #GRID
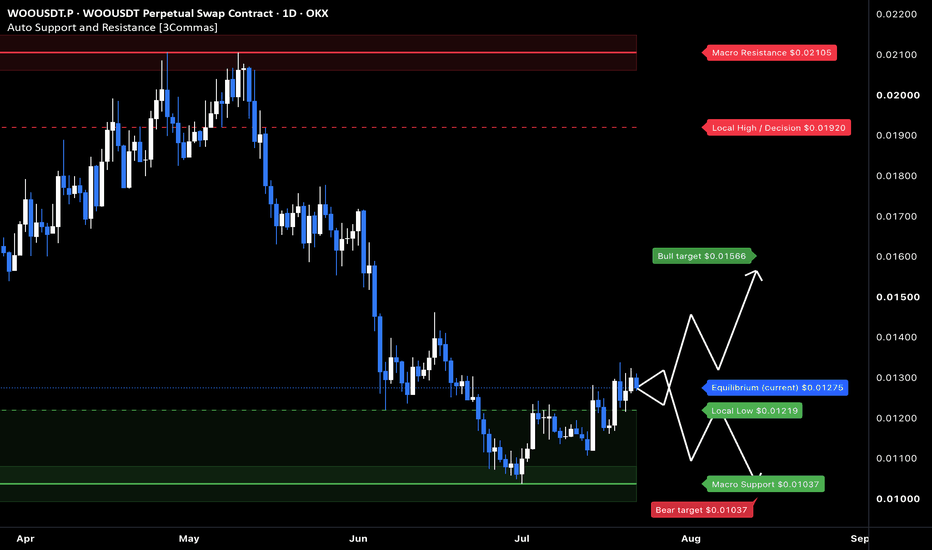
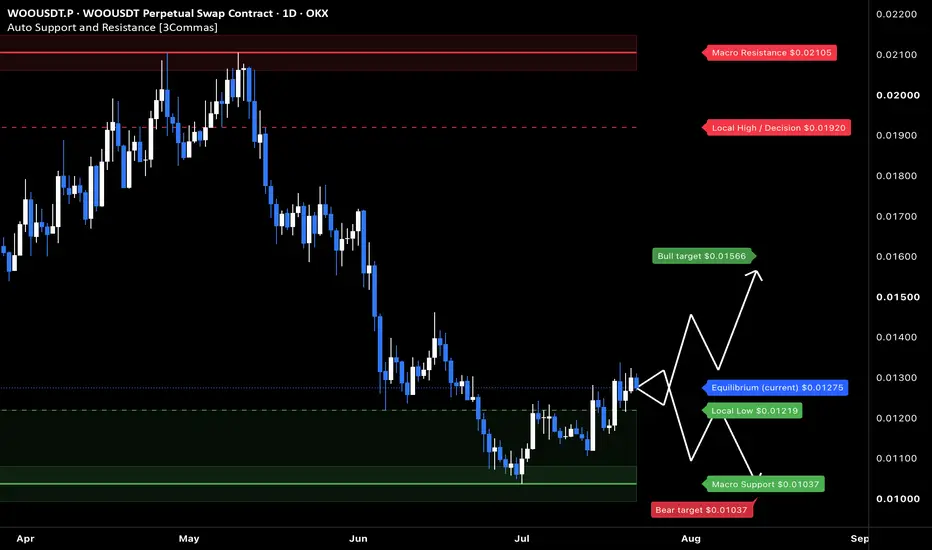
WOO: local squeeze with $0.0157 destinationThe Macro Picture 🗺️
WOO unwound from the $0.021 highs down to the $0.01037 floor in June, then reversed and reclaimed ground to $0.01278. Price is building higher off the base — the tape is rotating up rather than continuing to break down.
The Setup ⚙️
The Range Floor 🟢
$0.01037 (Macro Support) is the demand base, with $0.01219 (Local Low) as the nearer shelf. Both have held, and that's the floor this range pivots on.
The Decision Point 🔴
$0.01920 (Local High) is the structural gate. Before it, the $0.01569 measured-move target is the first objective — clearing it keeps the recovery intact.
The Roadmap 🛣️
Hold above $0.01219 → rotate up toward $0.01569 → then challenge $0.01920. Invalidation is a clean daily close below $0.01037 — that breaks the base.
This is a GRID Range Play: a defined band to rotate, buying the lower half and scaling out into strength.
More setups in profile.
#WOO #WOONetwork #crypto #trading #TA #3Commas #GRID
ENJ: local squeeze with $0.0349 destinationThe Macro Picture 🗺️
ENJ unwound the entire move from the $0.10 spike down into a tight base, and price is now coiling at $0.02815 in a narrow band. The volatility has compressed hard near the lows — the kind of squeeze that usually resolves with an expansion.
The Setup ⚙️
The Range Floor 🟢
$0.02508 (Local Low) is the immediate demand shelf, with $0.01893 (Macro Support) as the deeper floor. Holding above $0.02508 keeps the base intact.
The Decision Point 🔴
$0.02964 (Local High) is the gate. A daily close above it flips the local structure bullish and opens the path to the $0.03488 measured-move target.
The Roadmap 🛣️
Hold above $0.02508 → break $0.02964 → run toward $0.03488. Invalidation is a clean daily close below $0.02508, which reopens the $0.01893 macro floor.
This is a GRID Range Play: a defined band to rotate, buying the lower half and scaling out into the breakout.
More setups in profile.
#ENJ #Enjin #crypto #trading #TA #3Commas #GRID
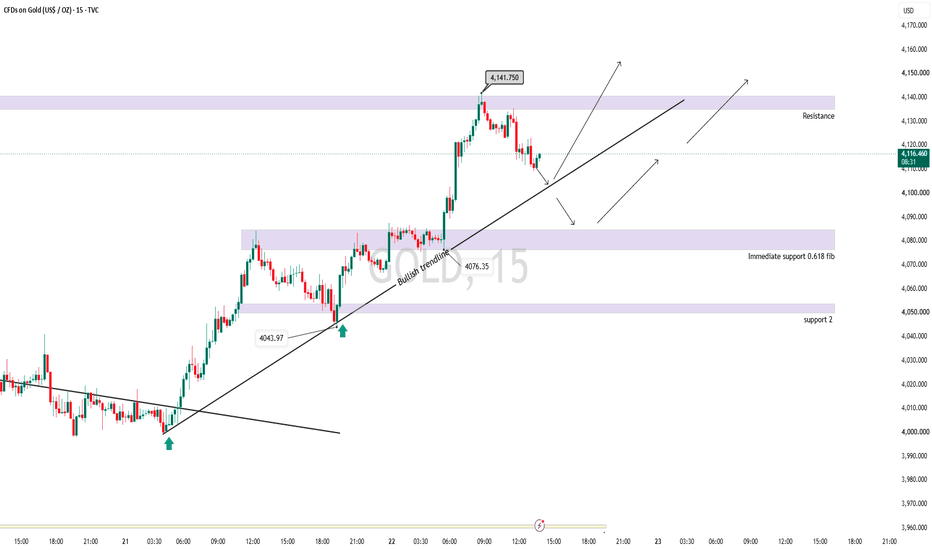
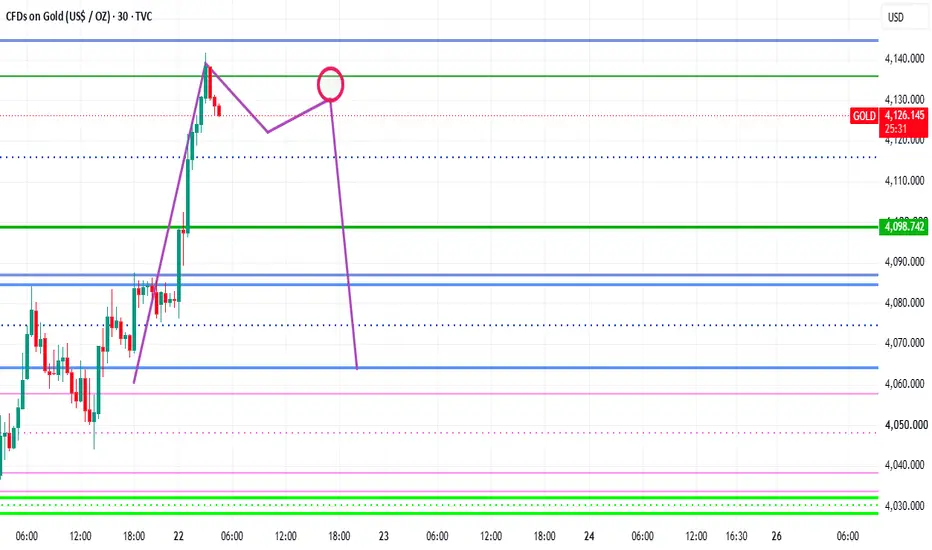
Gold(XAUUSD) outlook and trade setup for today.Price got rejected form an important resistance level of 4140, currently its retracing, the retracement might retest the horizontal support zone of 4080 and after consolidating tat that level for some more time might give a breakout on the bullish direction. Trend is very strong and there is very high chance of price continuing in upward direction.
Immediate resistance is at 4140 and support is at 4080 and below that next support is at 4045.
Outlook remain on the bullish to sideways direction, only buy trades should be preferred at support levels.
For Educational Purposes only, Not an Investment Advice, Always use strict Risk management measures.
Regards
CrazyTrades247.
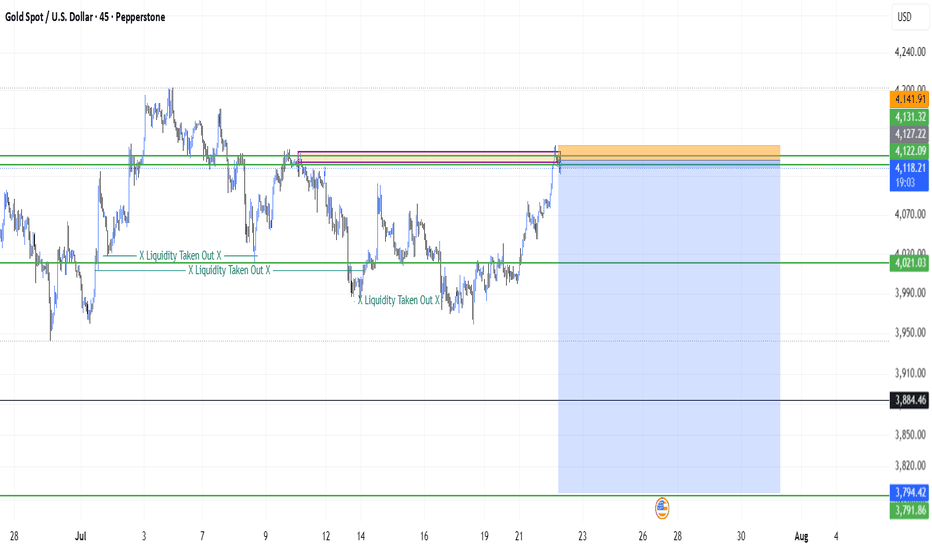
XAUUSD may be heading to $3795 - FxDollarsAnalysis -[22/07/2026]XAUUSD Short at cmp 4118, entry point was 4127
and Short limit at 4132
Stop loss at 4142
Take profit at 3795
Disclaimer:- This report is prepared for general informational purposes only and does not constitute personalized investment advice . This report includes general investment opinions such as buy, hold, or sell conclusions. All analysis is based on publicly available information and reflects the author’s independent judgment at the time of publication. The content is intended for distribution to multiple recipients and should not be relied upon for individual financial decisions. Vincent (Vishal Budhrani) is not licensed by the Hong Kong Securities and Futures Commission (SFC) to provide personalized investment advice.
#Gold #XAUUSD #MarketCrash #TradingView #FinanceNews #InvestSmart #Commodities #GoldPrice #TechnicalAnalysis
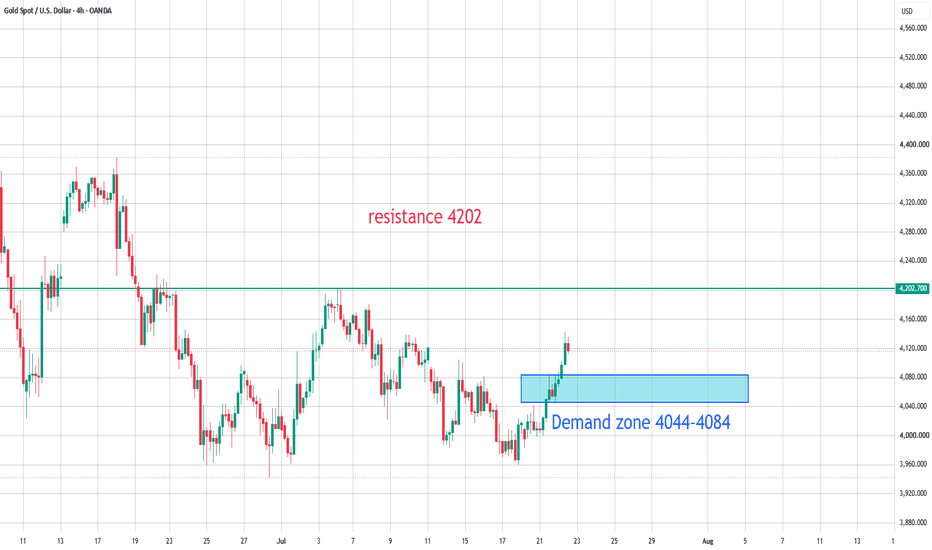
XAUUSD BUY 4084On the 4-hour chart, XAU/USD has stabilized and rebounded. Attention should be focused on the demand zone between 4044 and 4084; if the price pulls back and stabilizes there, further buying could be considered. To the upside, watch for resistance near 4202; a breakout could potentially form a double-bottom pattern.
XAU/USD 22 July 2026 Intraday AnalysisH4 Analysis:
-> Swing: Bullish.
-> Internal: Bearish.
Bias and analysis to remain the same as analysis dated 30 June 2026.
Price did not print bullish CHoCH to indicate bullish pullback phase initiation. Price instead printed a new low followed by a bullish CHoCH
Price is currently trading within and established internal range, however, I will continue to monitor price with respect to depth of pullback.
Intraday expectation:
Price to trade up to either premium of internal 50% EQ, or H4 demand zone before targeting weak internal low, currently priced at 3,942.100.
Note:
Gold remains volatile as tensions between the US, Israel, and Iran keep safe‑haven demand elevated.
Markets are reacting quickly to every headline, while uncertainty around the Fed’s easing path and shifting U.S. policy under President Trump, especially tariffs continues to fuel choppy price action.
For newer traders, the key is simple, stay flexible and manage risk carefully, as fast spikes and sudden reversals are a normal part of the current XAU/USD environment.
H4 Chart:
M15 Analysis:
-> Swing: Bearish.
-> Internal: Bearish.
Analysis and bias remains the same as analysis dated 20 July 2026.
Price has printed according to analysis dated 14 July 2026 where I mentioned price to trade up to either premium of internal 50% EQ, or M15 demand zone before targeting weak internal low, priced at 3,983.545. This is how price printed.
Price has subsequently printed a bullish CHoCH to indicate bullish pullback phase initiation. Price has since printed lower. Depth of pullback has been insignificant, therefore, I will not classify the bearish iBOS, however, I have marked this in red for illustration purposes.
Price has since printed a further bullish CHoCH and once again price is trading within an established internal range, however, I shall again monitor price action with regards to depth of pullback.
Intraday expectation:
Price to trade up to either premium of internal 50% EQ, or M15 demand zone before targeting weak internal low, priced at 3,959.800.
Note:
Gold remains highly reactive on M15 as geopolitical risk continues to drive quick, headline‑led moves.
The tension between the US, Israel, and Iran is keeping safe‑haven demand elevated, with markets still sensitive to any sign of escalation.
At the same time, shifting US tariff policy under President Trump is adding extra uncertainty, fuelling sharp intraday swings and increasing the likelihood of sudden sentiment flips. Liquidity pockets and whipsaws remain common, making disciplined risk management essential.
Gold’s geopolitical premium is still firmly in place, and until tensions ease, short‑term volatility is likely to stay front‑loaded.
M15 Chart:
BTC/USDT - Breakout From the Descending ChannelBreakout From the Descending Channel, but the Patience Test Is Not Over Yet
Katsu on the Command Bridge. Let’s check the BTC heavy cruiser on our radar.
On the BTC 4H chart, we are seeing an interesting structure right now. Price has broken upward from the previous purple descending channel, which looks positive at first glance. This shows that the momentum of the previous downtrend has weakened, and buyers have started to take back some control.
But I would not open the champagne yet.
The current movement can be placed inside a green ascending channel, but in my opinion, this is not necessarily the beginning of a strong and lasting uptrend. It looks more like the market is trying to escape the previous downward movement, but still does not have the clean strength needed to launch the rocket immediately.
I can rather imagine BTC moving for a while longer inside a range/channel/nerve-destroying sideways structure.
I will not bore anyone with my Elliott Wave theory, but in my opinion, this still looks very much like a wave 4. And wave 4 usually does exactly this. It stretches, twists, and exhausts the market until half of the traders no longer know whether they are long, short, or simply suffering from nervous system damage. :)))
In my opinion, this is roughly where we are now.
The black path is obviously not an exact prediction. It does not show that BTC will move candle by candle exactly like this. I only wanted to show the type of movement I am expecting. First, there may still be an upside attempt, then a longer and more exhausting sideways phase, and eventually even a deeper move lower.
Of course, a larger macro or geopolitical headline can mess this up at any time. If tensions around the Strait of Hormuz return, or if Mr. Trump drops another market-moving sentence, the chart can quickly rewrite the entire battle plan.
But based on the current 4H picture, there may still be an upside attempt in the short term. On the bigger picture, however, I am still clearly expecting lower prices, because wave 5 is still waiting.
Several important zones are marked on the chart:
green zones: 4H bullish Order Blocks / possible support areas
red zones: 4H bearish Order Blocks / possible resistance areas
purple, orange levels: 1H Order Blocks / possible support areas (important reaction support and resistance levels)
both 4H and 1H Order Blocks are also marked separately
This is useful because the 4H OBs provide the bigger picture, while the 1H OBs can help refine the entry.
The current price is around 65,900, so we are exactly in a zone where I would not want to enter blindly. Resistance above, support below, and in the middle we have the market doing its usual circus act.
In this situation, the question is not whether we go long or short now. The real question is what kind of reaction we get at each Order Block.
Important Zones
Resistance / Bearish Zones
67,259 - 67,428
This is the nearest important resistance zone. This is the first serious test for the current upside attempt. If price moves into this area but cannot stay above it, rejection may follow.
70,696
This is a higher resistance / decision area. If BTC reaches this level, many traders may become very bullish again, and that is exactly why it can be dangerous. This is where late longs can be collected.
73,182
This is the higher major bearish Order Block / supply zone. If price reaches this area, I would expect strong resistance.
Support / Bullish Zones
65,418
Nearby green zone. This is the first area where I would watch for a buyer reaction in case of a smaller retest.
64,528
Important 1H / intermediate reaction level. If 65,418 does not hold, this can become a more serious decision point.
63,485 - 62,319
This is already a deeper and stronger bullish OB area. If price returns here, I would pay much more attention to the long side reaction.
61,000
Important lower support and a more serious defensive zone.
58,637 - 57,133
Deeper retest / larger bullish OB area. If price drops here, then in my opinion most of the current upside attempt has already faded.
54,494
Deep defensive zone. If we get here, then we are no longer talking about the small channel, but about the larger bearish scenario being activated. This OB is almost 2 years old.
Market Structure
The breakout from the purple descending channel is a positive sign, but by itself it is not enough.
To treat this as a real bullish reversal, I would want to see the following:
price holds the 65,418-64,528 area
retests do not fall apart
local lows keep rising
the 4H structure does not close strongly back inside the previous descending channel
BTC eventually breaks through the 67,259-67,428 resistance area
If this happens, then we can start talking about the market trying to build higher toward 70,696, and possibly even 73,182.
But if the structure starts falling apart below the 65k area, then the current upside attempt can easily turn out to be only a corrective climb back.
Long Battle Plan - From an OB Retest
On the long side, I would not try to play hero at the top of the range. In my opinion, the cleaner long can come from a retest.
Long Setup - From the Deeper OB
This is actually the second and more patient long opportunity, but this is the only one I will share with you. This is the 63,485-62,319 zone. This would be a deeper retest, but many times these are the cleaner smart money entries, because by then the late longs have already been shaken out.
What I would look for:
slow drift or wick into the 63,485-62,319 zone
liquidity sweep
strong rejection candle
bullish structure shift on the lower timeframe
the zone holding after the retest
Possible Long Plan
Entry: 63,400-62,400, after confirmation
Stop Loss: below 61,000
TP1: 64,528
TP2: 65,418
TP3: 67,259
This long would be much cleaner for me than chasing the move around the current price.
Short Battle Plan - From Bearish OB Rejection
On the short side, there are two reasonable zones right now. One is the nearby resistance around 67,259-67,428. The other is the higher zone around 70,696.
I will write down the closer plan for you, because my analyses are already almost short novels when I try to explain everything. :)))
Short Setup 1 - Rejection From 67,259-67,428
This is the nearby short opportunity. If price moves into this zone but cannot stay above it, this could become a good reaction short.
What I would like to see:
price wicks into the 67,259-67,428 zone
momentum slows down there
a rejection wick appears
bearish ChoCh forms on the lower timeframe
price falls back below 66,000
then fails to reclaim that level on the retest
In simple terms: bearish OB -> wick up -> rejection -> bearish ChoCh -> retest -> short
Possible Short Plan
Entry: 67,000-67,500, after confirmation
Stop Loss: above 68,200
TP1: 65,418
TP2: 64,528
TP3: 63,485
This short looks good only if BTC simply wicks into the zone, collects the late longs, and then falls back below it. But if price closes strongly above 67,428 on the 4H timeframe and then holds the retest, this short idea is dead.
What Am I Watching Closely Now?
The most important question right now is whether BTC can hold the 65,418-64,528 area. If yes, the first upside part of the black path can work, and we may see an attempt toward 67,259-67,428, and possibly even 70,696. But if this zone fails, the current upside attempt weakens, and price could easily return toward 63,485-62,319.
And if 61,000 also fails, then I would pay much more attention to the larger bearish scenario, where 58,637-57,133 can also come into play.
This is not financial advice. The raccoon was simply thinking out loud about BTC today.
I wrote down what I see, what I think, and how I would trade it. Then either I am right... or we learn from it. :))
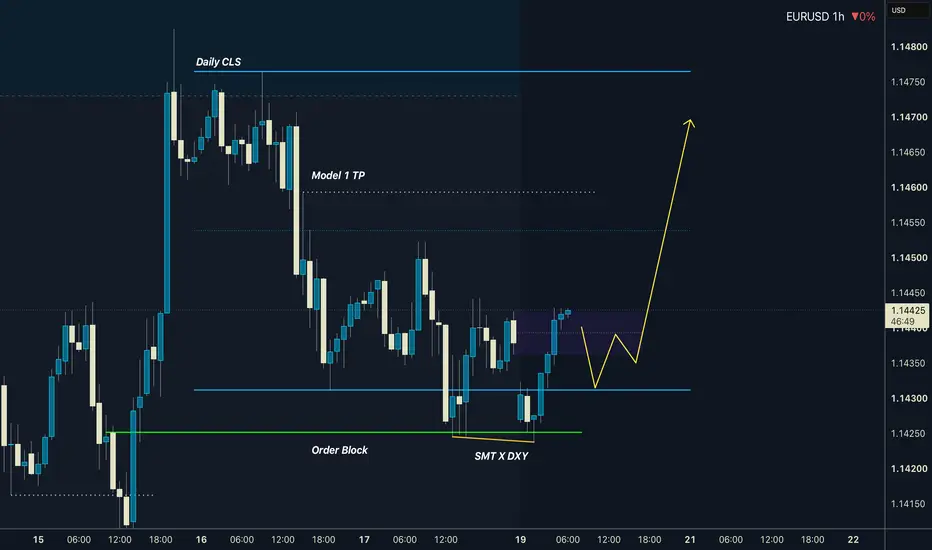
EURUSD - Daily CLS - Model 1Hi Friends, New CLS Range has been created and Im looking for Long Model 1 trade setup. As always after the manipulation in to the Key Level, below the CLS range and reaction, we need to see a confirmation switch from the manipulation phase - CIOD (change in order flow) in the the expansion.
⏳ Stay patient and enter only after candle close.
🎯 Target: 50% Liquidity - of the CLS range.
🎥 CLS Model 1 Video Explanation 📚 Bullish CLS Strategy Structure ⚠️ Risk Control is Key to Long Term Success
📍 Always place a proper stop loss
📍 Manage your risk per trade
📍 Stay disciplined & avoid emotional trading
📍Take the Trade only if you understand logic behind it
📍 Protect Capital First
🚀Boost | 🔁 Share | 💬 Comment | ✅Follow for more CLS setups
Adapt useful, Reject useless and add what is specifically yours.
David Perk