Long
Long
LCID: Short squeeze time! - July 2026SYMBOL: NASDAQ:LCID | DIRECTION: LONG | TIMEFRAME: Weekly
Published: July 2026
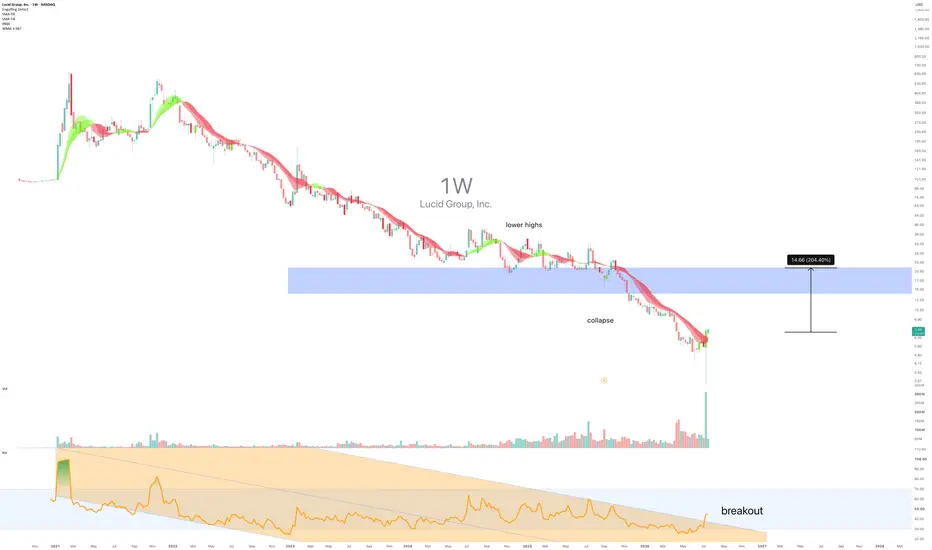
Right…. Short interest increases to 36.85% after 99.2% correction.
Melvin Capital, is that you?
Lucid Group Inc has been absolutely demolished. From thirty-one dollars down to seven, ignoring the 1/10 split. That is extraordinary. In a bad way, obviously. The stock has surrendered all short term gains, left in tatters by the market's sudden discovery that electric cars do not, in fact, solve climate change by existing. Who knew? Well, apparently everyone except the people who bought at the peak. But here is where it gets interesting. After such a violent, sustained collapse, the chart is now displaying something the casual observer tends to miss: the exhaustion patterns of a seller running out of ammunition. The volume is contracting on the downside. Multiple hammer and engulfing formations are stacking up across the daily and weekly timeframes. And yet the crowd is still convinced Lucid is headed to zero.
Bear with me.
On the above Weekly chart Lucid Group Inc has established a defined support zone between approximately fourteen and seventeen dollars, marked by a blue rectangle spanning the last six months of price action. A few distinct reasons now exist to expect a bounce of meaningful size to market structure. They include:
1. Hammer and Engulfing Confluence on Multiple Timeframes
The current weekly bar is rendering both a hammer and an engulfing pattern. The daily chart is doing the same. This is not noise. When reversal candlesticks appear in tandem across timeframes, they telegraph a genuine shift in pressure from seller dominance to buyer entry. After a seventy-seven percent evisceration, the fact that buyers are willing to step in at all is a signal worth acknowledging. Why would they bother unless something had changed? What do they know that I don’t?
2. Volume Contraction on Downside Moves
The volume profile shows a clear pattern: as price falls, volume is declining. This is a textbook hallmark of seller exhaustion. When every seller who wanted out has already left, who is left to drive price lower? The green volume bars clustering in the lower ranges suggest that capitulation is in its late innings. See the daily chart below, where the recent bounce saw volume surge notably, confirming the shift in demand.
3. Support Zone Holding Through Multiple Tests
The blue support rectangle at fourteen to seventeen dollars has been tested repeatedly over the past eighteen months. Price has bounced from this zone multiple times. It is not abstract. It is real structure.
The Absurdity of the Fundamental Setup
Lucid makes cars that nobody can afford, sells hardly any of them, and burns cash at a rate that would shame a small nation. And yet the stock was valued at over one hundred billion dollars at the peak. The fact that it is now worth 2.8 billion is still arguably too much. However, this is precisely why the chart matters. The market has already priced in catastrophic failure. When that much pain is priced in, reversals often happen not because the story improves, but because the hatred is exhausted. I am just the one willing to write it down.
Targets
4.66: Prior support zone and measured-move target from the engulfing pattern (+106% from current price)
17.50: Upper boundary of the blue support rectangle and key resistance level before structural recovery (+146% from current price)
- Invalidation: A weekly close below 5 (the 52-week low) cancels the thesis entirely.
The crowd
The consensus among serious investors is that Lucid is a zombie. They point to the cash burn, the tiny production numbers, and the fact that the global auto industry is already pivoting toward affordable electrification while Lucid remains stranded in ultra-luxury nonsense as a double dip recession approaches. These people are not wrong. They are simply stuck in a macro narrative at the exact moment the chart is signalling micro reversal. Fear has compressed this name so thoroughly that the technical setup is now flashing warning signals in the opposite direction. The algos and the shorts are positioned for one more flush downward. They are not expecting a bounce. That is precisely the environment where bounces tend to happen.
The broader truth is that nobody should own Lucid as a long-term investment. But a seven dollar stock that is generating multiple reversal signals after a ninety-seven percent collapse is a very different animal.
Remember the GameStop short squeeze?
This is not a belief in electric cars saving the planet. This is not even a belief in Lucid's business. This is reading what the price action is actually saying, independent of what the fundamental story deserves.
Good luck.
Ww
Type: LONG | Timeframe: Weekly
============================================
Disclaimer
This idea is for educational and informational purposes only. It is not financial advice. Equities involve significant risk. Always do your own research and consult a qualified financial adviser before making any investment decisions. Past performance is not indicative of future results.  Long
Long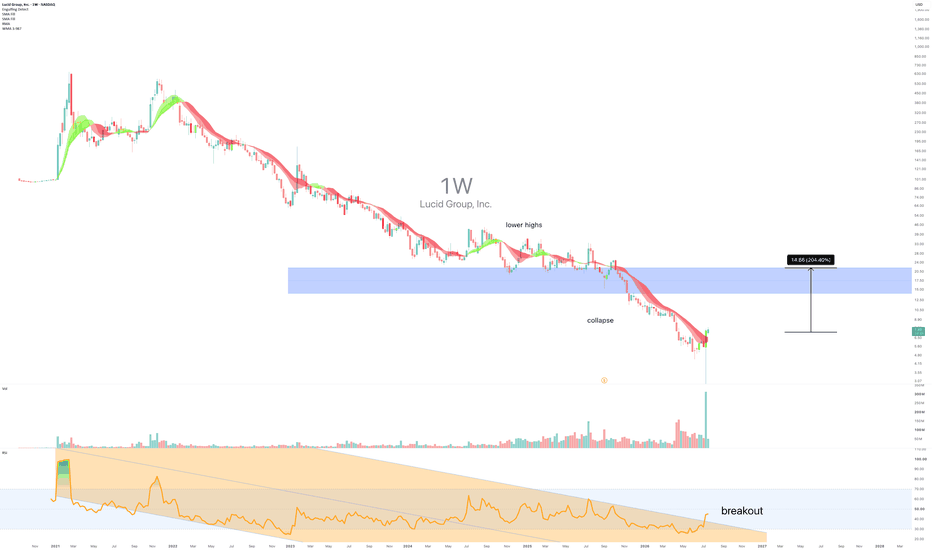
 Short
Short
Long 
 Long
Long
 Long
Long
 Long
Long
 Long
Long
 Long
Long
SPY Closed The Gap To 748 - Still No Break.SPY Closed The Gap To 748 - Still No Break.
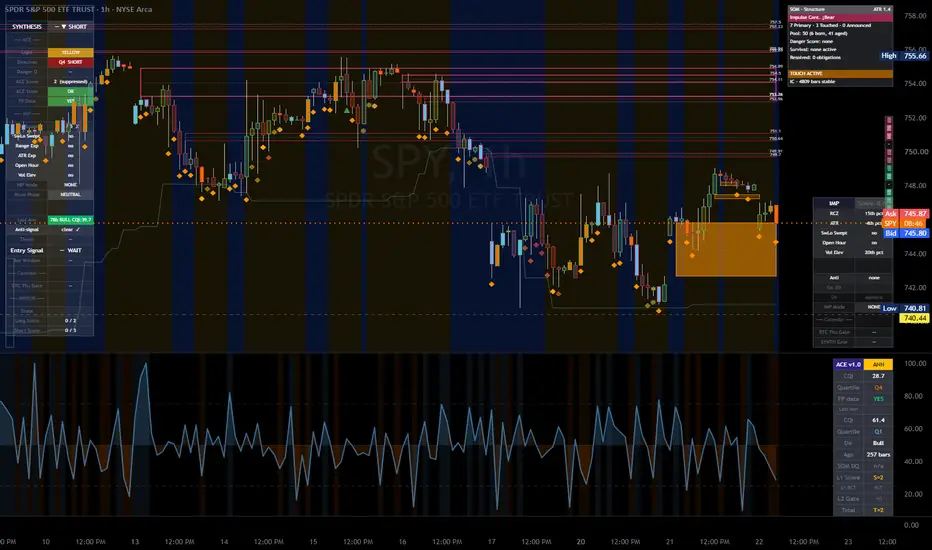
SPY pushed up to the 748 area and is trading 746, the closest it has held to the trigger yet - but it still has not closed above it. The daily structure is bull with a 235-bar bull print standing and conviction firm, though the hourly cooled back to neutral on the approach. This is now the fourth run at 748 without a confirmed break through. The story has not changed: the level is the event, and the level has not gone. Until it closes above 748, the honest read stays a range between 740.44 and 748. Neutral.
Resistance: 748.00 - the trigger, still unbroken
Key resistance: 751.00, then the 755.66 ceiling
Current price: 746.16
Support: 744.00 - first support
Key support: 740.44 - the range floor
Structural floor: 739.34 - the swept low
Two paths from here:
748 closes above and the range resolves up. A confirmed break with the daily bull print standing opens 751 and the 755.66 ceiling, and it is the event that would finally earn a directional call on the one name where breaks carry an edge. It is one point away; it just has to close there.
748 caps it a fourth time. Four failures at the same level is a genuine ceiling, not noise. A rejection here sends price back toward 740.44, and the range that has held for over a week stays intact.
SPY has closed the distance to 748 but still has not closed through it. One point away is not the same as above. The range is the range until the level breaks on a close.
Built with SYNTHESIS v3.3 | SOM / ACE / IMP / SYNTHESIS
Study, not financial advice.  Short
Short
Nifty Analysis EOD – 21 July, 2026 – Tuesday🟢 Nifty Analysis EOD – 21 July, 2026 – Tuesday 🔴
Defended, Not Decided: Bulls Hold 23,975 but Bears Drive the Close
🗞 Nifty Summary
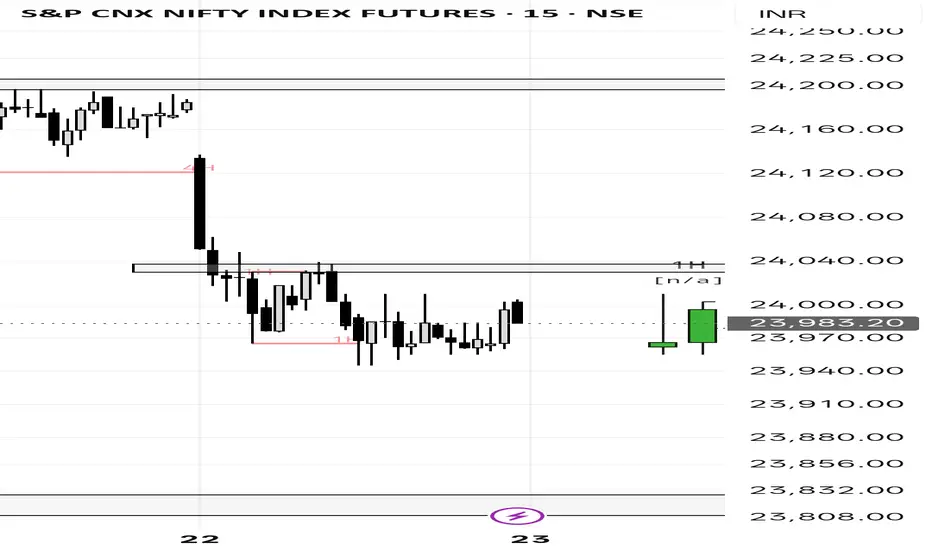
Nifty opened with a 48-point gap down on negative sentiment driven by geopolitical tensions. From the day’s high, it dropped sharply — a 157-point fall — where the 24,000 level tried to hold. After a 43-point recovery attempt, the index slipped again and tested the 23,975 support zone. That level held for the rest of the session like a strong floor, and from around 12:45 PM, the market settled into a tight 50-point range. The session ended in the middle of that range at 23,991.05, with an adjusted close of 23,996.25 — just below the psychological level of 24,000.
Today’s close is below the previous seven sessions’ closes and confirms a fakeout of the 17th July breakout zone. Bulls still have a base in the 23,975 ~ 24,030 zone, but today it looks like that grip is weakening — bears seem to be in the driver’s seat now. The daily candle is a bearish body with a modest lower wick, suggesting some demand did show up near 23,975 but wasn’t strong enough to push back meaningfully. Tomorrow is the key session — if today’s low holds, bulls get a chance to reset; if not, 23,900 and 23,785 may come into view.
🛡 5 Min Intraday Chart with Levels
📉 Daily Time Frame Chart with Intraday Levels
🕯 Daily Candle Breakdown
Open: 24,150.45
High: 24,166.30
Low: 23,961.40
Close: 23,996.25
Change: −191.45 (−0.79%)
🏗️ Structure Breakdown
Type: Bearish candle — sellers dominated the session from the open with limited recovery
Range: ≈ 205 points — moderate volatility
Body: ≈ 154 points — steady selling pressure through the session
Upper Wick: ≈ 16 points — barely any buying above the open, supply appeared almost immediately
Lower Wick: ≈ 35 points — some demand did step in near the lows, but not with enough force to matter
🛡 5 Min Intraday Chart
⚔️ Gladiator Strategy Update
ATR: 228.09
IB Range: 157.60 → Medium
Market Structure: ImBalanced
Trade Highlights:
10:23 Short Trade: Trailing SL Hit
11:53 Short Trade: Target Hit (R:R 1:3.81)
12:58 Short Trade: SL Hit
13:58 Short Trade: SL Hit
Trade Summary: The day had four short trades — one target hit, one trailing SL, and two SL hits. The 11:53 trade did the work, closing at a solid 1:3.81 R:R, but the afternoon gave back some ground. The two SL hits in the second half were clean exits — the system did what it was supposed to, even if the outcome wasn’t in our favour. Two out of four is not the day I wanted, but the process held. Tomorrow I’ll come in fresh and let the levels do the talking.
🧱 Support & Resistance Levels
Resistance Zones: 24,260 | 24,300 | 24,360 ~ 24,380 | 24,430 | 24,460
Support Zones: 24,200 ~ 24,160 | 24,100 | 24,030
🧠 Final Thoughts
“The floor held today, but the market doesn't hand out ownership for just showing up.”
The notable thing today was how 23,975 held through the afternoon. The index tested it, sat on it, and refused to break — but equally refused to bounce with any real intent. That kind of price action where a level holds but buying doesn’t follow is worth watching. It’s not a sign of strength; it’s more like the bears pausing before the next move.
For tomorrow, 23,975 ~ 24,030 is the zone that matters. If the index opens above and defends it, bulls might get a chance to stabilise and push toward 24,100. If that floor gives way, 23,900 becomes the next meaningful area to watch, and below that 23,785 is on the map.
I’ll keep the bias short until the structure says otherwise. No need to overthink it — the market has been fairly clear about direction today, and tomorrow I just need to follow what the levels show me, not what I want to see.
✏️ Disclaimer
This is my personal digital diary and represents my own analysis and point of view. It is not financial advice; please consult a professional advisor before making any trading decisions. EURUSD: Bearish Drop to 1.138?FX:EURUSD is eyeing a bearish reversal on the 1-hour chart , with price testing resistance after a short-term uptrend, converging with a potential entry zone that could trigger downside momentum if sellers defend amid volatility. This setup suggests a pullback opportunity, targeting lower support levels with more than 1:3 risk-reward .🔥
Entry between 1.146–1.147 . T arget at 1.138 . Set a stop loss at a 4-hour close above 1.1485 , yielding a risk-reward ratio of more than 1:3 . Monitor for confirmation via a bearish candle close below entry with rising volume, leveraging the pair's weakness near resistance.🌟
Fundamentally , EURUSD is trading around 1.143 in late July 2026.
For the Euro, one of the most important releases this week is the Eurozone CPI Flash Estimate (July) and ECB-related communications, where softer inflation would increase rate cut expectations and pressure EUR lower.
For the US Dollar, the highlight is the FOMC Minutes or key Fed speeches (mid-to-late week), where hawkish tones would strengthen USD and support bearish pressure on the pair. 💡
📝 Trade Setup
🎯 Entry (Short):
1.1460 – 1.1470
🎯 Target:
1.1380
❌ Stop Loss:
• 4-hour close above 1.1485
⚖️ Risk-to-Reward:
• More than 1:3
💡 Will EURUSD reject the 1.1460–1.1470 resistance zone and retrace toward 1.1380, or will buyers break higher and invalidate the bearish setup? 👇 Selena | XAUUSD 1H – Bullish Recovery Scenario PEPPERSTONE:XAUUSD FOREXCOM:XAUUSD
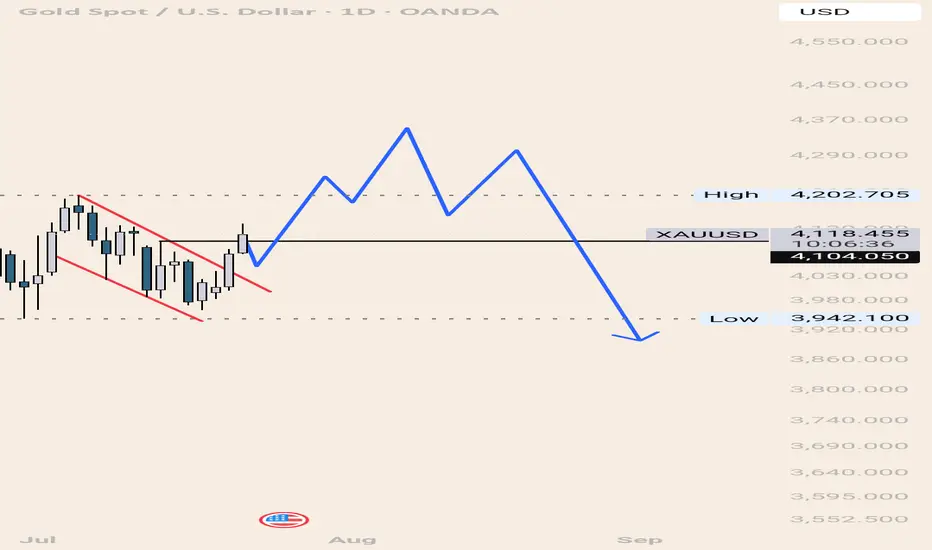
Gold remains in a corrective phase after breaking out of the descending channel and is currently retesting a key demand zone. The ongoing pullback appears to be a healthy correction rather than a reversal, with buyers expected to defend support before attempting another move higher. A successful reclaim of the resistance zone around 4,150–4,170 could strengthen bullish momentum and open the path toward the next major resistance levels.
Bullish Targets 🚀
🎯 Target 1: 4,170
🎯 Target 2: 4,250
🎯 Target 3: 4,400–4,500
Key Levels
🟢 Support: 3,940–4,000
🔴 Resistance: 4,150–4,170
Market Bias: Bullish, provided buyers continue defending the demand zone and price breaks above the immediate resistance with strong momentum.
Educational purposes only — not financial advice. Long 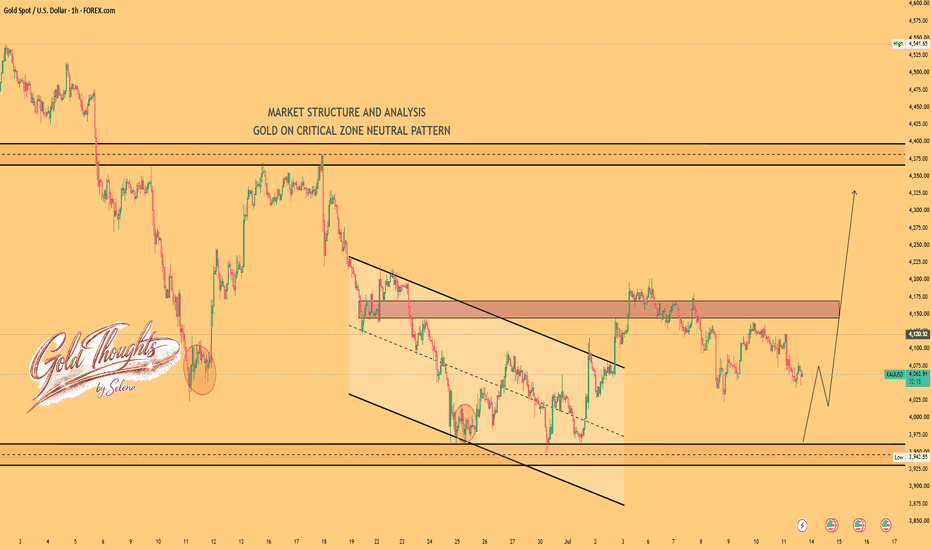
 Short
Short