Clearing House officially Selects QNT. Utility unlocked? The Clearing House officially selects to QNT to advance its on chain money initiative. The Clearing House settles $2 Trillion each day.📈
$730 Trillion annually.💰
The Clearing House = Critical Payments Infrastructure 💯
“The Clearing House's essential role in the U.S. banking industry has been the same since it was founded in 1853.”🙇♂️
Now operating on
NASDAQ:QNT
infrastructure🌐
This is coinciding with a very nice qnt pump the likes of which we haven’t seen on qnt in quite sometime. Still not
Symmetrical Triangle
HBAR Macro Symmetrical Triangle — $0.56 Breakout Target & $3.09 HBAR/USD | 1M Chart | Macro Technical Setup
HBAR is compressing inside a large multi-year symmetrical triangle, with price continuing to respect both the descending macro resistance line and rising support from the cycle lows.
On the monthly timeframe, this is becoming a significant compression structure. Price is currently around $0.084, so the setup remains unconfirmed — the important event would be a decisive breakout and higher-timeframe acceptance above the descending trendline.
The Tria
NEAR Protocol — Multi-Year Symmetrical Triangle NEAR Protocol is approaching the apex of what appears to be a multi-year symmetrical triangle, formed by a sequence of lower highs pressing against a rising support structure.
This consolidation has been developing since the 2022 cycle high and represents a significant compression in NEAR's long-term price structure.
The Pattern
The structure is characterized by:
Descending resistance connecting the major 2022, 2024 and subsequent lower highs
Ascending support connecting the major bear-marke
NEAR Protocol Update: Is the Multi-Year Breakout Starting? | $20NEAR/USD — Follow-Up to My Multi-Year Symmetrical Triangle Setup
This is a follow-up to my previous NEAR Protocol analysis, where I identified the multi-year symmetrical triangle that has been compressing since the previous market cycle.
In this video, I revisit that setup and break down where NEAR currently sits within the structure, what I’m watching for confirmation, and why a successful higher-timeframe breakout could become significant.
The primary technical setup remains:
Multi-Year Sy
JPN225: Triangle broken, Trade in profit what comes next?In this video is the update to the Nikkei 225 trade idea from 3 September 2026, when Japan’s 10-year bond yield surpassed 3% for the first time since 1996 and the index dropped by 2.85% to its lowest levels in four weeks at 64,325. Entry: 63,000-64,274. Descending triangle was the formation and the contracting MACD histogram which was deep into the negative zone was the trigger;the exact setup that called for the best week for the Hang Seng since March 2025. On 4 September Softbank and AI semico
(XAUUSD) — Wedge Compression Before a Two-Legged Liquidity Sweep**Gold (XAUUSD) — Wedge Compression Before a Two-Legged Liquidity Sweep 🟡**
**Market Structure Overview:**
Gold rallied from the 4,320 base all the way to 4,720, then reversed sharply — leaving behind a clean **bearish Order Block (OB)** in the 4,600–4,640 zone where the drop originated. Since then, price has retraced down to retest the 4,320 support twice and is now compressing inside a **descending/symmetrical triangle**, squeezing between lower highs and a flat support base.
**Key Levels &
Meesho: Symmetrical Triangle Near BreakoutMeesho is approaching a decisive point on the daily timeframe, trading within a well-defined Symmetrical Triangle after recovering from its recent correction. The stock has been forming higher lows while facing a descending resistance trendline, signaling a contraction in volatility before a potential expansion.
Price is currently consolidating just below resistance, with demand repeatedly stepping in near the rising trendline.
📊 Technical Highlights
✅ Symmetrical Triangle nearing completion
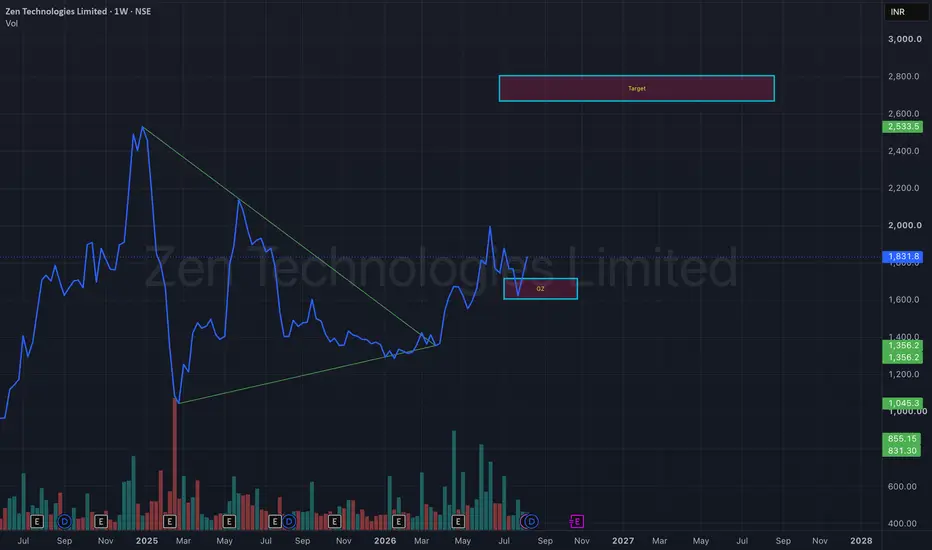
Zen Technologies: Symmetrical Triangle Breakout LoadingZen Technologies has been consolidating within a Symmetrical Triangle on the weekly timeframe, following a sharp rally and subsequent correction. The narrowing price range indicates that both buyers and sellers are reaching equilibrium, often leading to a strong directional move once the pattern resolves.
The recent breakout above the upper trendline suggests buyers are attempting to regain control, while the former resistance zone now acts as a key demand area.
📊 Technical Highlights
✅ Symme
SOLUSD Break Below 71 Could Extend Losses Toward 56Solana has recovered toward the key $75.00 area, but the broader trend remains bearish. The chart is forming a symmetrical triangle, so the next breakout may determine the direction of the larger move.
A confirmed breakdown below $71.88 could strengthen selling pressure and open the way toward $62.50 and $56.25. The bearish Bollinger Bands, negative MACD and overbought Stochastic oscillator support this scenario.
The bullish outlook would become relevant only after a breakout and consolidation
DASHUSDT Symmetrical Triangle Breakout Setup (1H)BINANCE:DASHUSDT DASH broke out of its long-term falling wedge and is currently consolidating within a clear symmetrical triangle. The price is squeezing tightly between converging slopes, signaling an imminent directional move.
The blue "Buy zone" ($31.08 - $31.31) aligns perfectly with structural support. If bulls push above the triangle's upper trendline with volume, a breakout rally is expected.
📌 Key Levels:
Buy zone: $31.08 - $31.31 (Wait for a confirmed breakout or retest).
Stop
Gold at a Critical $4,000 Support: Rebound or Breakdown?Gold ( OANDA:XAUUSD ) is currently trading near the Heavy Support Zone, the key trading level of $4,030, the Potential Reversal Zone(PRZ), and the psychological level of $4,000.
On the 4-hour time frame, the Symmetrical Triangle remains the most important technical structure to monitor.
Can gold hold above $4,000 and begin a recovery, or is another bearish breakdown approaching?
Technical Analysis
Gold appears to have been moving inside a Descending Channel over the past 12–13 days.
From an
Gold in a Symmetrical Triangle — Which Way Will It Break?Gold ( OANDA:XAUUSD ) has been trading inside a Symmetrical Triangle over the past three days, and a breakout from either trendline could determine its broader direction over the coming weeks.
The price is currently testing the Resistance Zone and the upper trendline of the Descending Channel.
Can gold break higher, or is another move below $4,000 approaching?
Technical Analysis
From an Elliott Wave perspective, gold appears to be completing a Zigzag Correction.
A Negative Regular Divergenc
GBPJPY Breakdown: Is a Deeper Correction Beginning?GBPJPY ( OANDA:GBPJPY ) started to decline after reacting to the upper boundary of the Ascending Channel and the resistance zone(221.35 JPY-219.32 JPY).
After breaking below the support lines, the pair formed a Symmetrical Triangle, and its lower trendline has now been broken.
Can GBPJPY recover, or is the pair entering a deeper corrective phase?
Technical Analysis
From an Elliott Wave perspective, GBPJPY appears to have completed its main Five-Wave Impulsive Structure above the Ascending Ch
KARURVYSYA: Symmetrical Triangle Breakout ConfirmedKARURVYSYA Bank – Breakout Update
Symmetrical Triangle breakout confirmed with strong volume.
Pattern Support: ₹285–₹300
Major Support: ₹270
Upside Target: ₹372
Bullish structure remains intact above the breakout zone.
Any dip near support may offer a better risk-reward buying opportunity.
thank you !!
NZDCAD - Short-Term Resistance Before the Range High?NZDCAD has been trading within a well-defined range for an extended period, with price continuing to respect both the major support and resistance areas while developing a green symmetrical triangle.
After rejecting the lower support area, price recovered and is now approaching a smaller supply zone before reaching the upper boundary of the broader range.
⭕This supply zone may provide an opportunity to look for sell setups on lower timeframes, particularly if price shows signs of rejection be
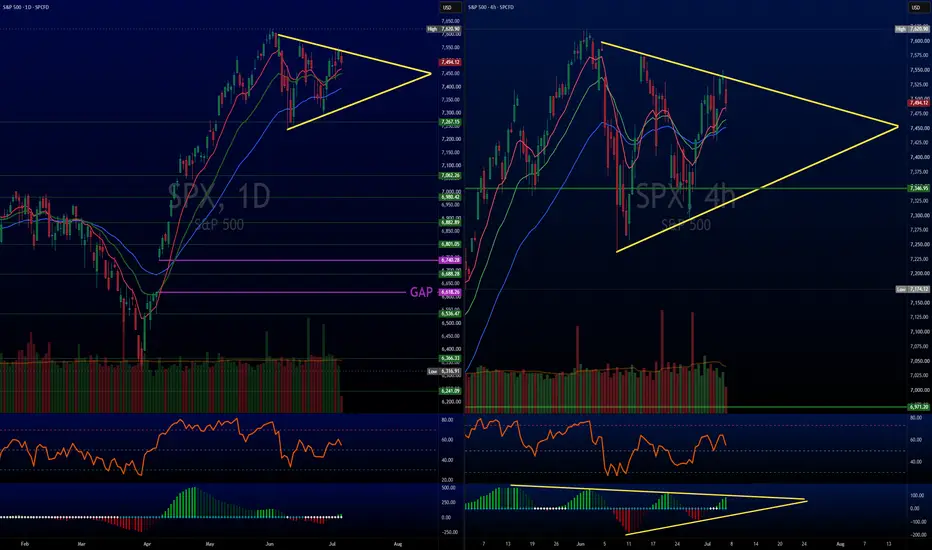
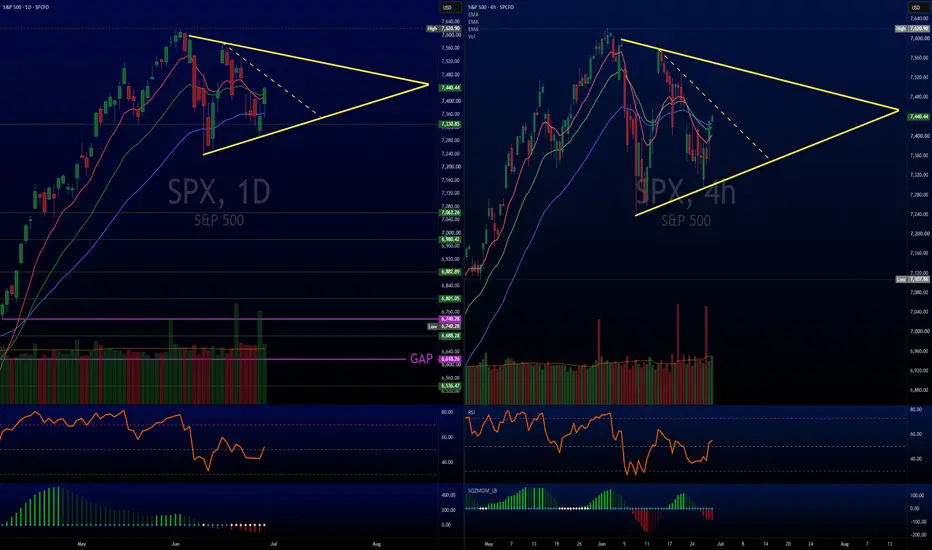
SPX Multi Timeframe Symmetrical Triangle Pt2When a market squeezes tightly into the final tip of a macro chart pattern, tracking the inner timeframes reveals a battlefield of false breakouts and rapid institutional positioning. Following up on our recent analysis of the S&P 500 SPCFD:SPX Symmetrical Triangle, the structural physics have shifted into an environment of extreme near term whipsaws.
1. The Daily Stalemate
Looking at the Daily macro chart, market has completely ground to a halt, flatlining right against its zero momentum lin
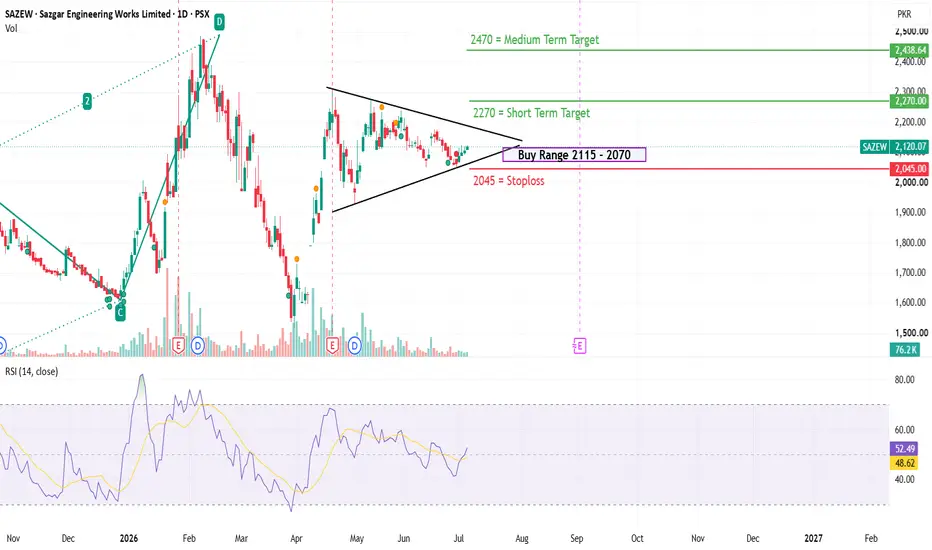
SAZEW gaining MomentumSAZEW – Symmetrical Triangle Consolidation Setup
Market Structure:
SAZEW is consolidating tightly near the apex of a high-probability **Symmetrical Triangle** pattern on the Daily timeframe. Volatility is contracting heavily, signaling an impending breakout. The RSI holding structural support right at the 50-midline indicates a balanced auction ready for expansion.
Execution Parameters:
Bias: Long on structural confirmation
Execution Range (Entry): 2,070 – 2,115 PKR
Invalidation (SL): 2,045
S&P 500 ($SPX) Daily Update: Index Remains Locked in SymmetricalS&P 500 ( SPCFD:SPX ) Daily Update: Index Remains Locked in Symmetrical Triangle – Tactical Range-Playbook Rules Until Breakout Confirmation
### 🇺🇸 S&P 500 Index ( SPCFD:SPX ) Mid-Weight Macro Brief (Ref: SPX_2026-07-06_10-22-10.png)
We are releasing an essential structural update on the S&P 500 Index ( SPCFD:SPX ) on the Daily (1D) time matrix. Following a brief breakout attempt last week, aggregate institutional order flow failed to secure structural acceptance above the local descending res
MARI ENERGIESMARI (Mari Energies Limited): Symmetrical Triangle Breakout
MARI has officially transitioned into a strong bullish structure following a definitive upside breakout from a multi-month Symmetrical Triangle consolidation pattern. This explosive price expansion is technically validated by a massive surge in trading volume (1.17M), signaling robust institutional accumulation rather than a market fakeout.
Momentum indicators are in full alignment with this move. The MACD has executed a fresh bullish
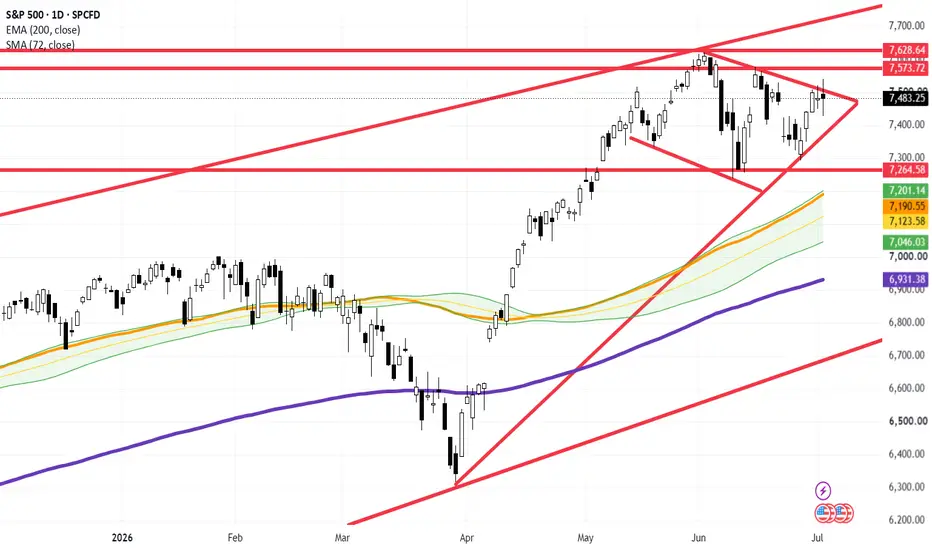
S&P 500 ($SPX) Daily: Price Tests Crucial Volatility CompressionS&P 500 ( SPCFD:SPX ) Daily: Price Tests Crucial Volatility Compression Ceiling Inside Major Resistance Cluster
### 🇺🇸 S&P 500 Index ( SPCFD:SPX ) Macro Technical Update (Ref: SPX_2026-07-01_08-40-38.png)
We are deploying an updated institutional structural study on the S&P 500 Index ( SPCFD:SPX ) on the Daily (1D) matrix. The benchmark global equity index has entered a high-stakes technical junction, consolidating inside a major volatility compression model right beneath historical distributio
SPX Navigates a Multi Timeframe Symmetrical TriangleWe spoke on Market Wide Squeeze and the Defensive Rotation a few days ago. Let's touch on it again.
When a market enters a heavy consolidation phase, tracking multiple timeframes is the only way to separate true institutional direction from daily noise. Right now, the SPCFD:SPX is carving out a massive, clean Symmetrical Triangle pattern that is rapidly approaching its apex.
The Pattern: Equilibrium Ready to Uncoil
A symmetrical triangle represents absolute equilibrium. A sequence of lower
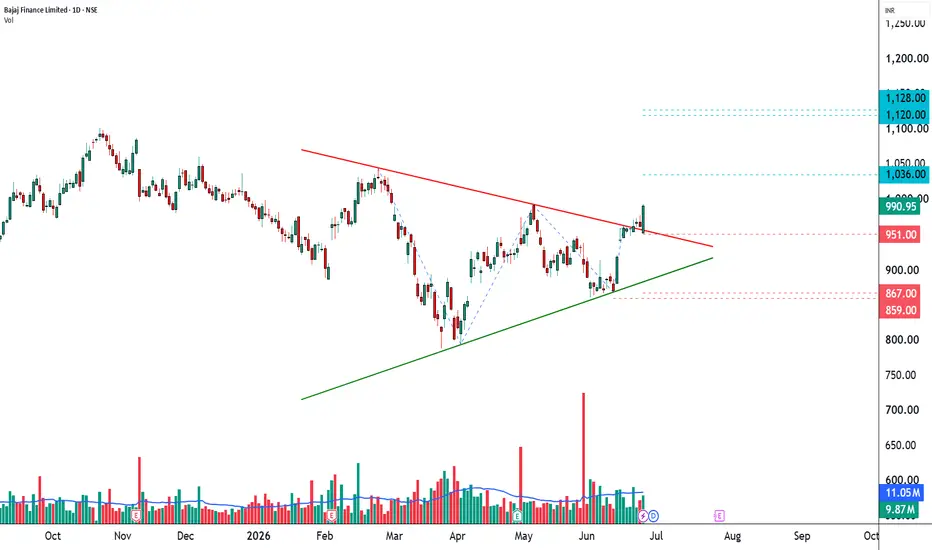
BAJFINANCE Emerging From 4-Month Compression────────────────────────
📊 STWP BREAKOUT ANALYSIS
Stock: Bajaj Finance Limited (BAJFINANCE)
Trend: Bullish
Pattern: Symmetrical Triangle Breakout
Range High/Low: 1046 - 792.45
Range Duration: 4 Month
Breakout Probability: Strong (89%)
Volume Participation: High | Volume Expansion: 0.89x
Breakout Level: 993
Retest Level/Levels: 960.00
Invalidation Level/Levels: 951 | 867.00 | 859.00
Reference Level/Levels: 1,036.00 | 1,120.00 | 1,128.00
Next Level: Watch Reference Levels
───────────────────────