USNAS100 | Bearish Below 30,500 — 30,160 in FocusUSNAS100 | Bearish Below 30,500 — 30,160 in Focus
Nasdaq remains under bearish pressure while trading below the 30,500 pivot.
As long as the price stays below this level, the next downside target remains 30,160.
A confirmed stabilization below 30,160 would strengthen the bearish continuation toward:
29,970 → 29,680
On the bullish side, stability above 30,530 would support a recovery toward:
30,800 → 31,030 → 31,300
Today’s PCE inflation and GDP data remain important catalysts and could crea
Trend Lines
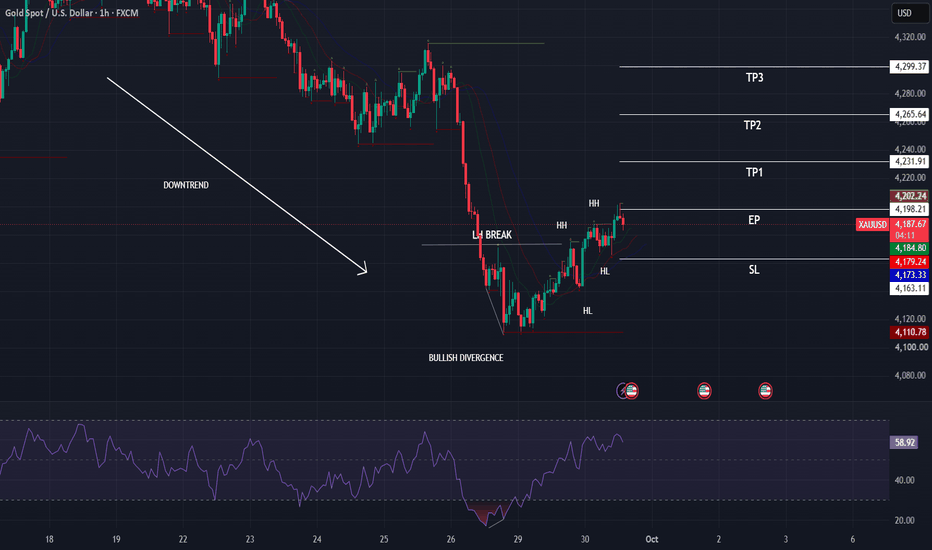
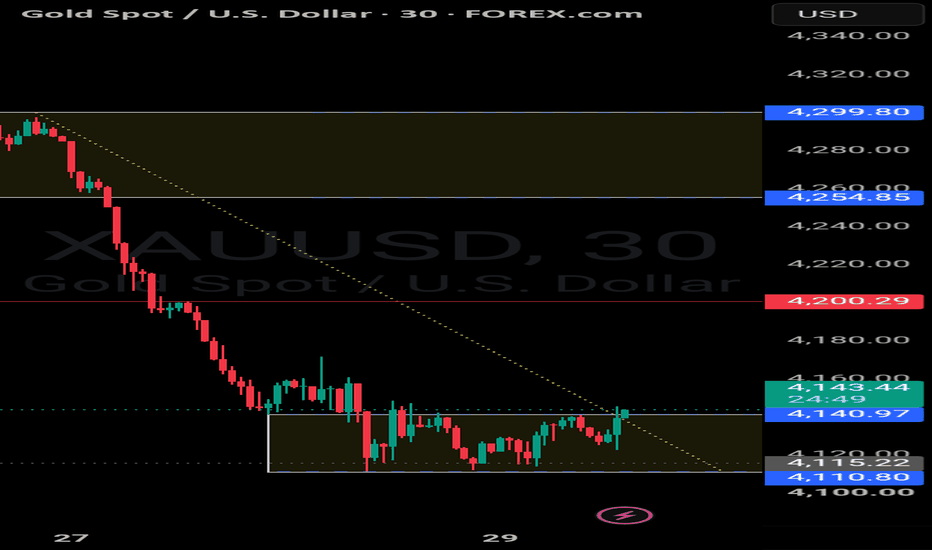
XAUUSD — Bullish Reversal After 1H Structure ShiftGold has remained in a bearish trend over the past few weeks. However, a bullish RSI divergence developed on the 1H timeframe, with price forming a lower low while RSI formed a higher low, signaling weakening bearish momentum.
The reversal gained confirmation after the previous lower high was broken, followed by a shift toward higher highs and higher lows.
My analysis was completed on the 1H timeframe, while execution was refined on the 15M timeframe using Bill Williams Fractals. The stop loss
DXY 1H: Bearish Divergence Confirmed as Rising Trendline BreaksDXY remains bullish on the broader structure after rallying from 99.61 to 101.61, but signs of momentum exhaustion are becoming increasingly visible. Price has repeatedly formed higher highs while RSI has produced lower highs, creating bearish divergence.
After rejecting the 101.60 resistance, DXY has now broken below its ascending trendline, while RSI has dropped below the 50 level. A confirmed breakdown and failed retest of the trendline could open the way for a deeper correction.
The first ma
USDCHF Wave Analysis – 29 September 2026– USDCHF broke key resistance level 0.8280
– Likely to rise to resistance level 0.8400
USDCHF currency pair recently broke through the key resistance level 0.8280, which previously stopped upward impulse in September and which intersects with the daily up channel from August.
The breakout above the resistance level 0.8280 accelerated the active impulse wave iii of wave (c) from September.
Given the clear daily uptrend and the strong US dollar bullish sentiment, USDCHF currency pair can be exp
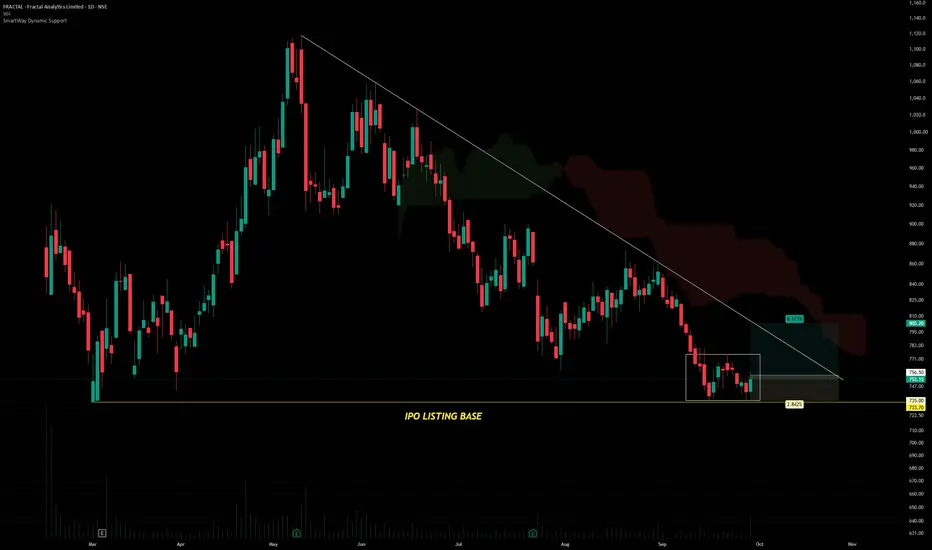
FRACTALFractal Analytics Ltd. (CMP ₹754.00, NSE: FRACTAL)
The SmartWay Research Desk | 29 September 2026
A Mumbai‑headquartered Artificial Intelligence and Advanced Analytics company, founded in 2000. Fractal Analytics specializes in AI, machine learning, generative AI, data engineering, decision intelligence, and enterprise analytics solutions, serving clients across healthcare, retail, consumer goods, insurance, banking, and technology sectors globally.
Promoter Holding (Jun 2026): Srikanth Velama
SMC Trendline + Fibonacci 0.5–0.618 + 1.5–1.7 Target ModelSMC Trendline + Fibonacci 0.5–0.618 + 1.5–1.7 Target Model
This model combines Trendline Breakout, Liquidity Sweep, Fibonacci Retracement and Fibonacci Extension to build a structured SMC setup. The main idea is to use the trendline for direction, the 0.50–0.618 area for retracement/entry context, and the 1.5–1.7 extension area for potential target delivery.
1. TRENDLINE — FIND THE DIRECTION
First identify a clear trendline connecting meaningful swing highs or swing lows.
For a bullish setup
Gold Is Correcting Again - Planning the Key Levels
🥇 Gold Is Correcting Again — I’m Planning the Levels Before Price Gets There
Gold has entered another uncomfortable phase on the weekly chart.
After such a powerful advance, a deeper correction can quickly change sentiment. The same market that investors were eager to buy at higher prices suddenly becomes much less attractive once the candles turn red.
For me, that’s exactly when having a plan becomes useful.
I’m not trying to answer the question:
“Where will gold bottom?”
Instead, I’m
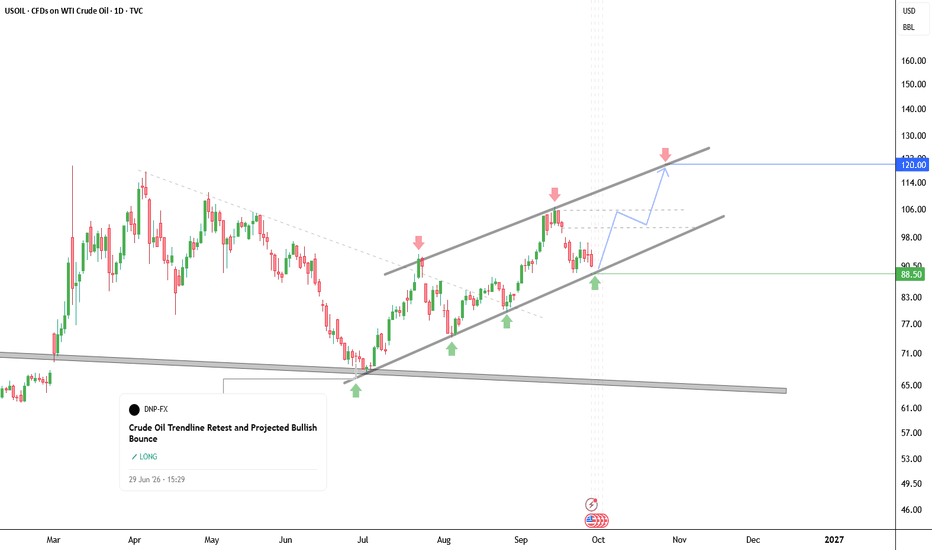
USOIL Long Trendline Retest on Daily ChartThe USOIL chart on the daily timeframe illustrates a well-maintained uptrend moving cleanly inside a rising channel. Price action is currently testing the lower trendline area around the 88.50 level, which has previously served as a strong support multiple times and successfully triggered upward price bounces. This area serves as a crucial zone for buyers to re-enter the market and resume medium-term trend dominance.
Although recent sessions have shown bearish pullback pressure bringing prices
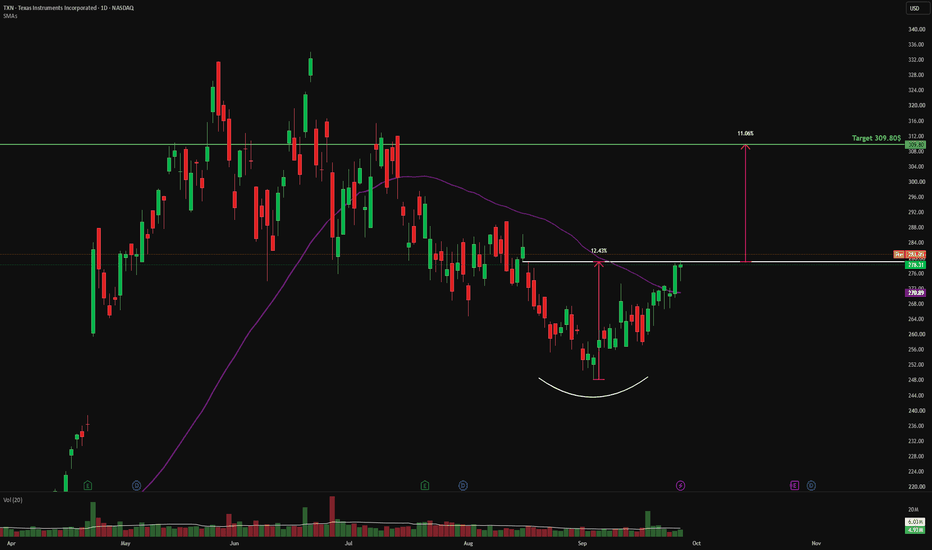
TXN: 50 SMA Cross with Cup Pattern and Rising Volume💡 Swing setup idea
50 SMA Strategy
🔎 Analysis summary:
The stock just crossed the 50-day moving average with growing buyers volume. We can also see a closing of a cup pattern. This alignment of trend, pattern and volume makes the breakout area key to watch. The upside potential is projected by the depth of the cup from the breakout point.
👀 Levels to watch:
Entry trigger: Break above $279.00
Target: $309.80
Stop: Under the support
💬 Will TXN break through resistance and continue higher
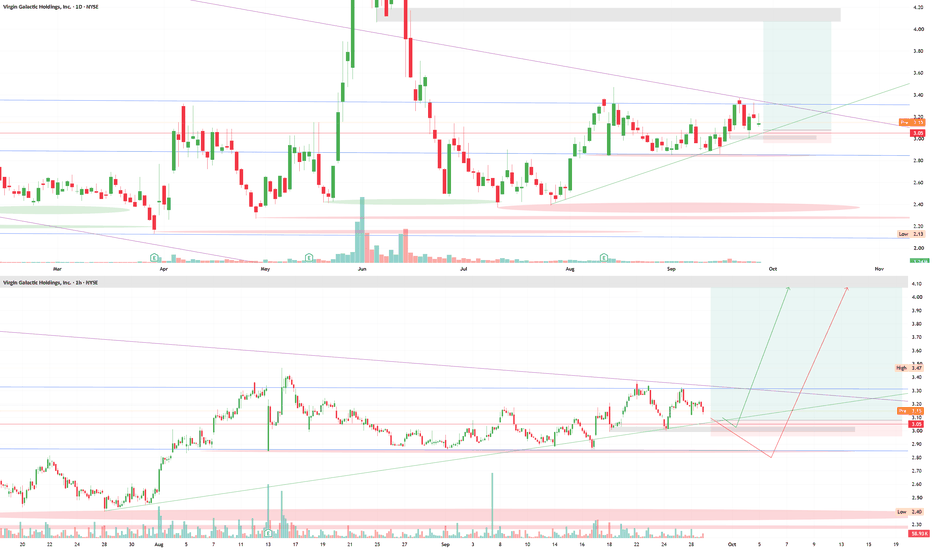
SPCE - Ready for blast off? Short-term trade ideaThe more I analyze NYSE:SPCE , the more I believe it's priming for a move back to HTF supply at $4.10. That's a massive level where tons of liquidity was exchanged during the previous rip up.
Thankfully I've stayed patient here for a while because we haven't done too much in the past few months. Nor do I think we are ready for an extended move past $4.
However, though there is tons of obvious liquidity sitting just underneath the $3/$2.50 levels, I also am seeing the bulls really stepping at
EURUSD is Nearing a Strong Resistance Area!Hey Traders, in today's trading session we are monitoring EURUSD for a selling opportunity around 1.13700 zone, EURUSD is trading in a downtrend and currently is in a correction phase in which it is approaching the trend at 1.13700 support and resistance area.
Trade safe, Joe.
META Breaks $780, Can AI Momentum Push It to $800?Key Highlights
Meta stock jumped 11.34% to close at $741.25 on Monday, September 21, its largest one-day gain in over a year, after Wells Fargo raised its price target to $796 from $640 and Muse reached number one on Apple’s U.S. App Store.
Muse, Meta’s personal AI agent, launched on September 8 and reached roughly 2.5 million to 2.8 million downloads within about 12 to 16 days, overtaking ChatGPT, Claude, and Grok on the U.S. App Store. Some days saw around 300,000 downloads.
Shares clos
GBPUSD: Very Bearish Price Action 🇬🇧🇺🇸
GBPUSD will likely continue falling after a confirmed breakout of a support line
of a bearish flag pattern on a 4h time frame.
The next goal is 1.319
❤️Please, support my work with like, thank you!❤️
I am part of Trade Nation's Influencer program and receive a monthly fee for using their TradingView charts in my analysis.
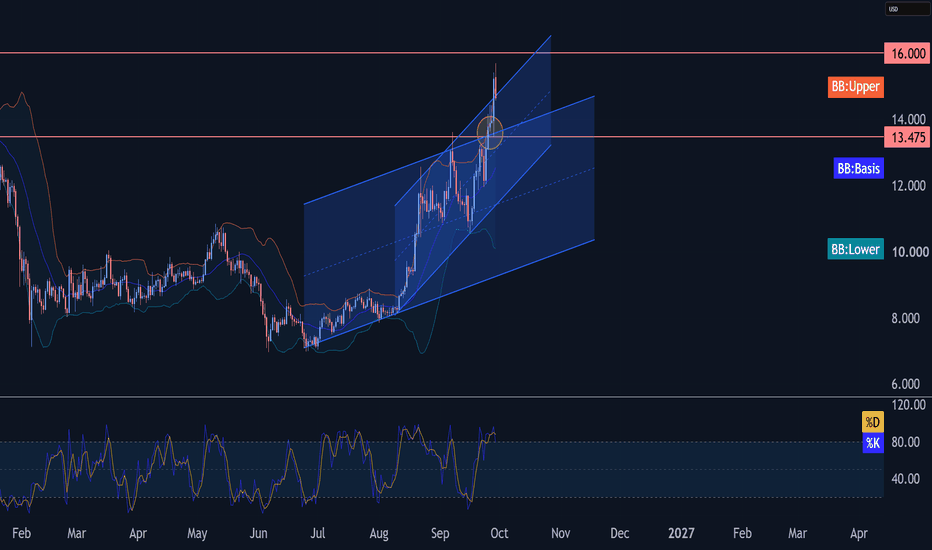
Chainlink Wave Analysis – 28 September 2026– Chainlink broke key resistance level 13.475
– Likely to rise to resistance level 16.00
Chainlink cryptocurrency recently broke through the key resistance zone located between the resistance level 13.475 (which previously stopped the impulse wave A in late August) and the upper trendline of the daily ascending channels from August and June.
The breakout above this resistance zone accelerated the active minor impulse wave (i), belonging
to the larger impulse wave C from September.
Give
Natural Gas Wave Analysis – 28 September 2026– Natural Gas reversed from resistance level 3.400
– Likely to fall to support level 3.000
Natural Gas recently reversed down from the resistance zone located at the intersection of the resistance level 3.400 (which previously stopped major price advances in March and June) and the 50.0% Fibonacci correction level of the downward impulse from January.
The downward reversal from this resistance zone stopped wave iii of the sharp impulse wave C from August.
Given the strength of the 3.400 resis
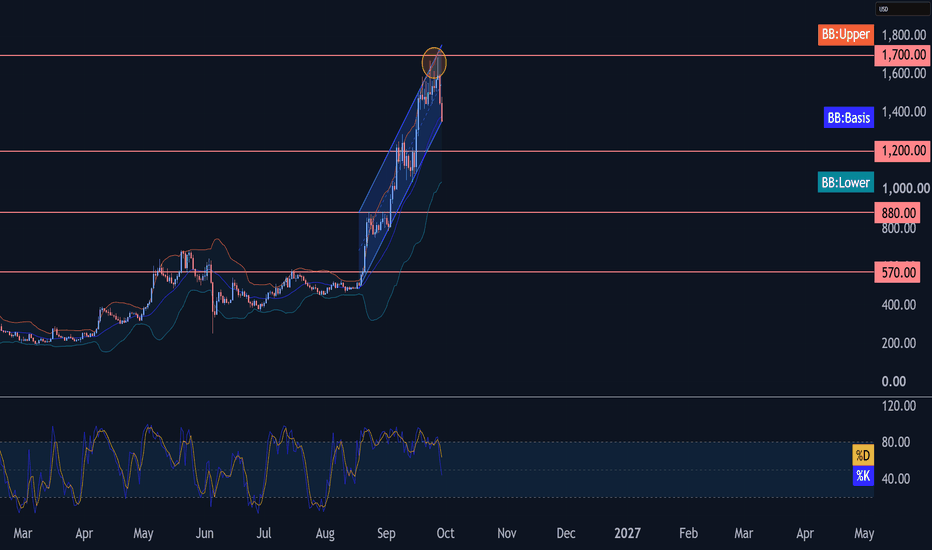
Zcash Wave Analysis – 28 September 2026– Zcash reversed from resistance zone
– Likely to fall to support level 1200.00
Zcash cryptocurrency recently reversed down from the resistance zone between the resistance level 1700.00 and the upper resistance trendline of the daily up channel from August.
The downward reversal from this resistance zone stopped the earlier impulse wave (iii) and started the short-term corrective subwave (iv) – that belongs to higher impulse waves 5 and (C).
Given the bearish divergence and the overbought r
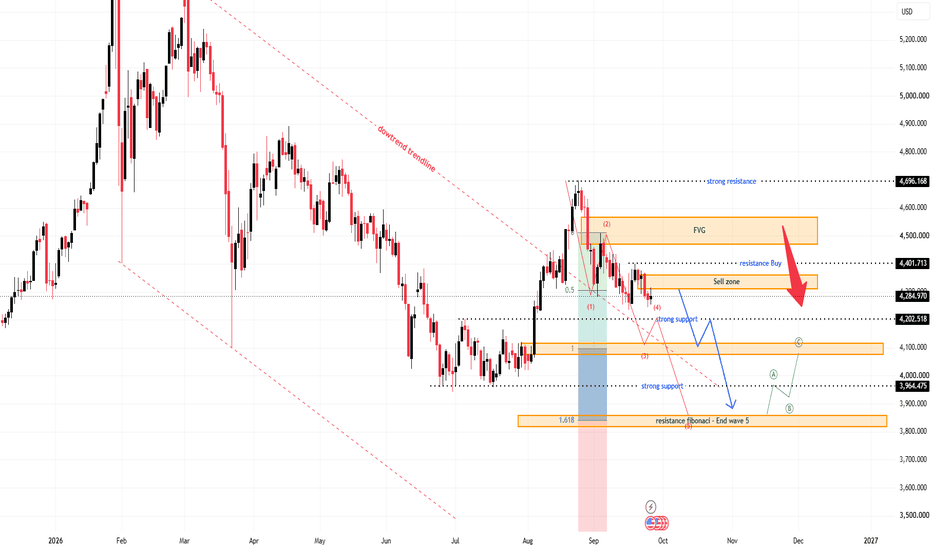
XAUUSD — Weekly Bearish Map Toward 3,850
Gold is entering next week with a heavy structure after failing to hold above the recovery zone. From Kelly’s view, the chart suggests that XAUUSD is still trading under the larger downtrend pressure, and the current price action looks more like a bearish continuation setup than a confirmed bullish reversal.
The key idea is simple: gold is still below the main sell zone and below the larger downtrend structure. If buyers cannot reclaim resistance, sellers may continue to push price toward the l