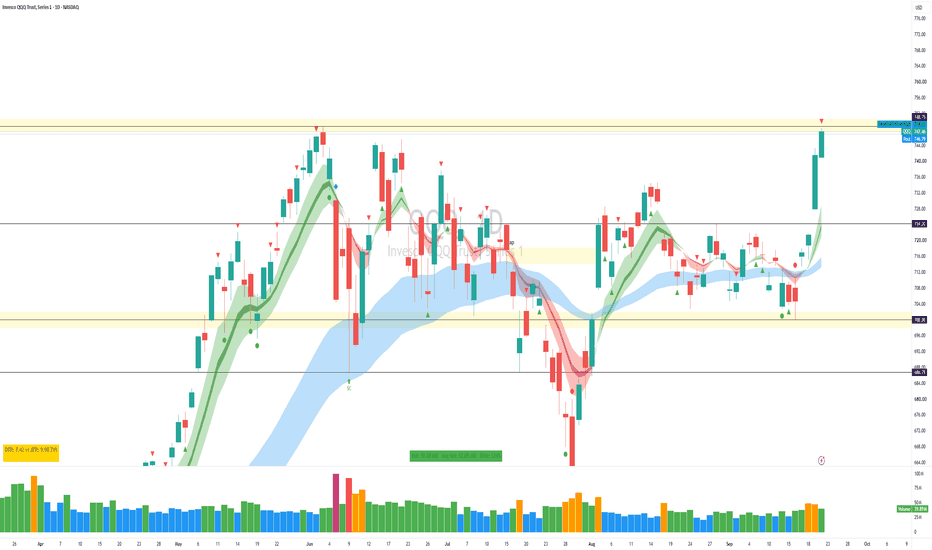
$QQQ — All-Time High Test Arrives as Expected, Momentum CoolingAs flagged — an all-time high test was expected. Here it is. NASDAQ:QQQ closed 747.46, up 0.81%, with a high of 748.35, within 30 cents of the 748.65 all-time high.
Tomorrow, 748-750 is the area to watch closely.
One thing on today's bar: range came in at 74% of ATR against 151% yesterday, and volume eased to 39.68M from 46.63M. Still above average, but cooling.
Second day up, smaller range, less volume, straight into the biggest resistance on the chart. Judge 748-750 by the volume that shows up there, not the touch.
Levels
Below: 740.93, then 733-735, then 724.20.
NASDAQ:QQQ
Trend Lines
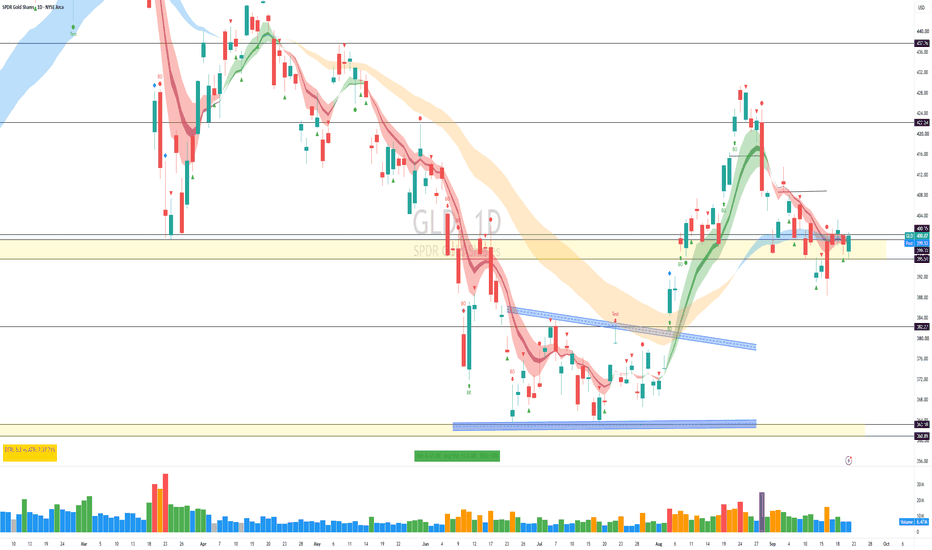
$GLD — Test Followed Through, But the Breakout Is Still on ProbaClosed over 400. Same view as yesterday.
Yesterday's session printed a Test near the key level — price dipped in, sellers didn't show up, and it closed off the low. Today price followed through and finished at the top of its range, right on 400.
That's the sequence worth seeing: Test first, then follow-through. The Test asks the question, the next bar answers it.
One thing to stay honest about — volume is still running well below average. Price is doing the work, size isn't behind it yet. A breakout that arrives on light volume is a breakout on probation.
Framework unchanged
Above 400 — bullish. Targets 405, 408, then 410+.
400 to 395 — neutral.
Below 395 — bearish.
We're at the edge of the band. Let the volume confirm it.
AMEX:GLD
USDCHF Wave Analysis – 22 September 2026– USDCHF reversed from support zone
– Likely to rise to resistance level 0.8270
USDCHF currency pair recently reversed up from the support zone located between the pivotal support level 0.8200 (former resistance which reversed the price in July) and the 38.2% Fibonacci correction of the upward impulse wave from the start of September.
The upward reversal from this support zone continues the active impulse wave (iii), which belongs to the extended impulse wave C from the start of May.
Given the strong daily uptrend, USDCHF currency pair can be expected to rise toward the next resistance level 0.8270.
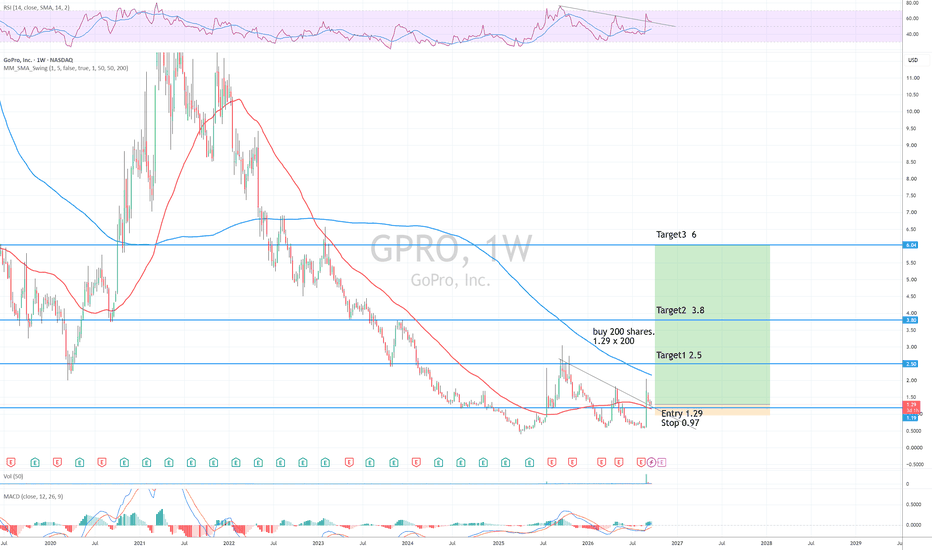
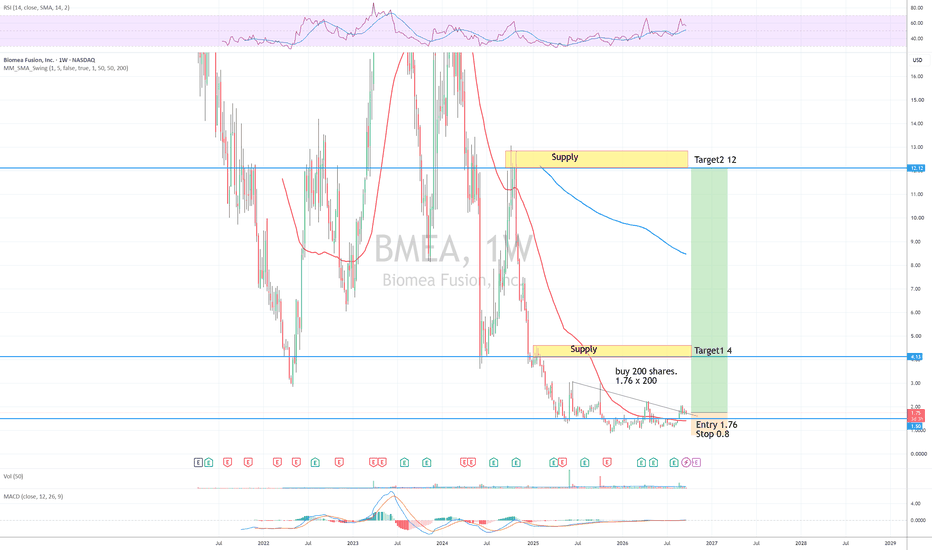
GPRO Long Trendline break + retest, weekly SMA50 as support
Entry 1.29
Stop 0.97
Target 2.5, 3.8, 6
Risk management is much more important than a good entry point.
I am not a PRO trader. About 25% of my trades had been stopped quickly.
buy 200 shares.
1.29 x 200
If stopped at 0.97, stop loss about 0.32x 200
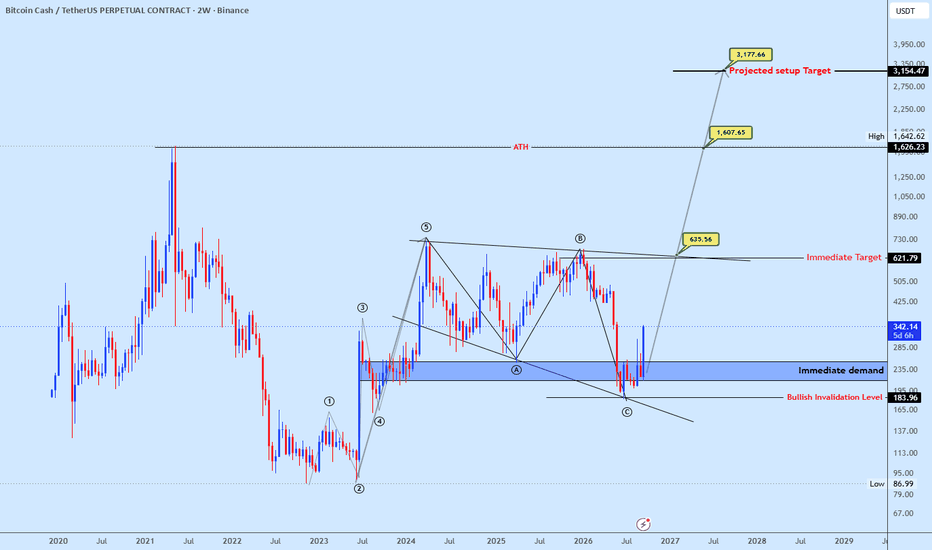
BCHUSDT Larger Wave May Be DevelopingThe long-term structure is becoming interesting. Following the completion of the ABC corrective structure, price has reacted from the $184–$235 demand zone and is now attempting to develop a new impulsive advance.
The current structure is also forming beneath a major descending resistance line, with $621.79 acting as the key breakout level. A confirmed breakout and sustained acceptance above this level could open the path toward $1,417, followed by the larger projected target around $3,154.
For now, the key levels remain:
Immediate demand: $184–$235
Key breakout level: $621.79
Next target: $1,417
Projected target: $3,154
Bullish invalidation: $183.96
The wave structure is constructive, but confirmation remains essential.
Probability over prediction.
WESLAD Research
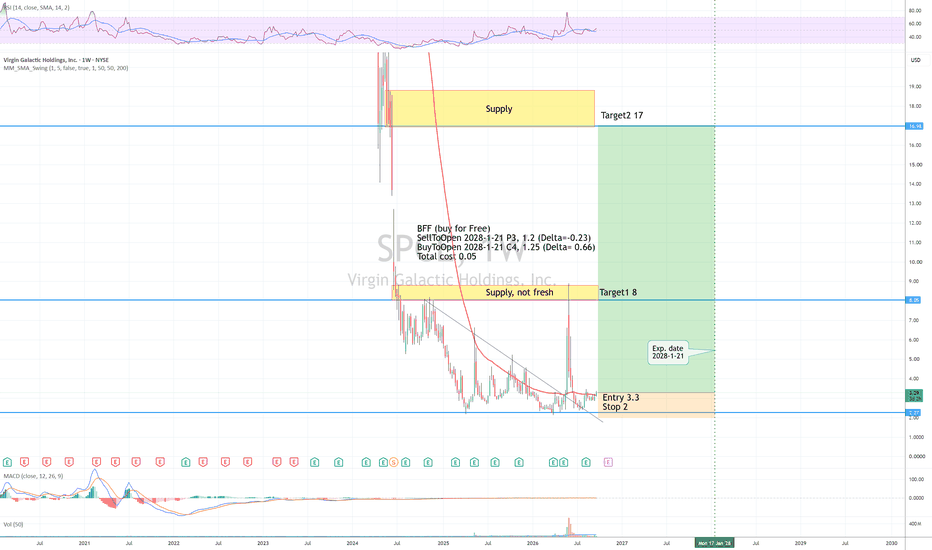
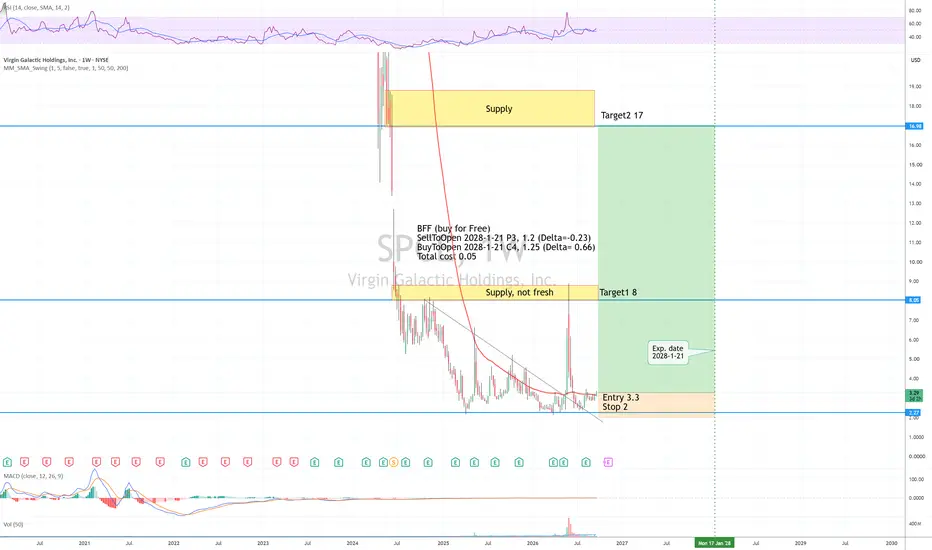
SPCE Long Trendline break + retest, weekly SMA50 as support
Entry 3.3
Stop 2.0
Target 8, 17
Risk management is much more important than a good entry point.
I am not a PRO trader. About 25% of my trades had been stopped quickly.
BFF (buy for Free)
SellToOpen 2028-1-21 P3, 1.2 (Delta=-0.23)
BuyToOpen 2028-1-21 C4, 1.25 (Delta= 0.66)
Total cost 0.05
If this option plan is stopped at 2, stop loss about 1.2
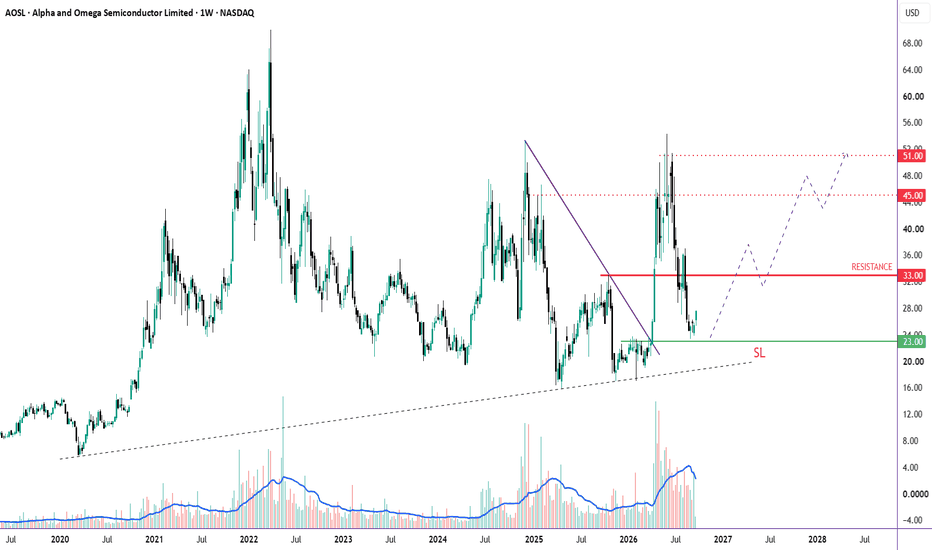
AOSL: Breakout Retested - Another 120% Rally?Story:
📊 The Pattern
AOSL broke out above a multi-year descending trendline in 2026, rallying hard toward the $54. Since then it's pulled back to retest the original breakout level — the same zone now marked as support at $23.
⚡ The Confirmation
This week's ongoing candle is a strong confirmation candle from the support, right at the breakout retest zone — the level that needs to hold for the structure to stay intact.
🎯 Levels to Watch
🟢 Support / breakout retest: bullish while holding above $23.00 (SL)
🔴 Resistance 1: $33.00
🔴 Resistance 2: $45.00
🔴 Resistance 3: $51.00
🧠 The Read: Same structure as the POWI setup — trendline breakout, rally to resistance, pullback to retest the breakout zone, and a bounce holding support. As long as $23 holds, the levels above are the logical stepping-stone targets for the next leg.
Chart study, not financial advice.
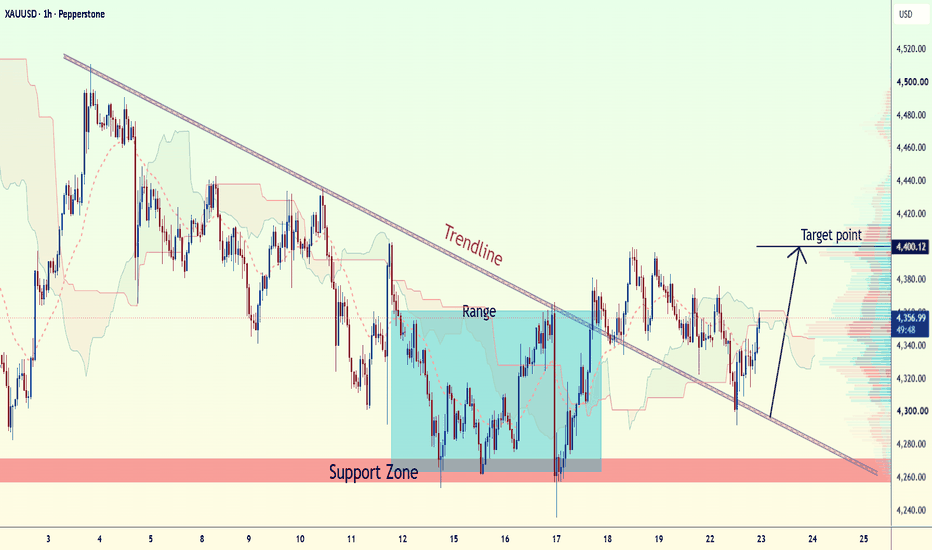
XAUUSD Bullish Breakout – Trendline Resistance RetestGold is showing a potential bullish setup after breaking above the descending trendline and holding the breakout area as support. Price is consolidating above the **4,300–4,320 support region**, while the previous range resistance has been challenged. A sustained move above **4,360** could strengthen the bullish continuation toward the marked target.
🎯 **Target: 4,400**
🛡️ **Key Support: 4,300–4,320**
📌 **Confirmation: Break and hold above 4,360**
This setup remains dependent on price maintaining the breakout structure.
GBPJPY Bearish Rejection – Resistance to SupportGBPJPY is approaching a strong **resistance zone around 211.50**, where price may face selling pressure. The chart shows a potential rejection from this resistance, with the projected move targeting the rising trendline/support area around **209.58**. A confirmed bearish rejection could open the path toward the target while price remains below the resistance zone.
**🎯 Target:** **209.58**
**🔴 Resistance:** **211.50**
**📌 Key Support:** **209.58**
**Bias:** Bearish below the 211.50 resistance zone, targeting a pullback toward 209.58.
ORLY - Higher time frames are aligning for a trade setupThe weekly/daily are lookin' flaggy.
On the monthly, you can see us fighting to hold a 6 year trend line - having teased it and taken lower time frame liquidity on strong volume.
I'm tempted to risk the $82 lows and take it to the upper end of the taper at $98.
However, I think the better play is to wait for a break above the flip zone at $90, risk $88 as our stop, and play the breakout to ATH's.
But definitely an enticing setup if today's turnaround can prove to be the beginning of new bullish momentum.
Happy Trading :)
HON | Continued stock growth- Timeframe: Weekly
- Trade type: Buy stop order
- Price: 210.59
- Take Profit: Open
- Stop Loss: 196.98 (-6.50 %)
Idea: Long on a breakout above last week's high - bullish momentum continuation.
Entry: Buy stop above last week’s high.
Stop-loss: Below the low of the same candle.
If the weekly candle closes below this level, the trade is invalidated.
HLong
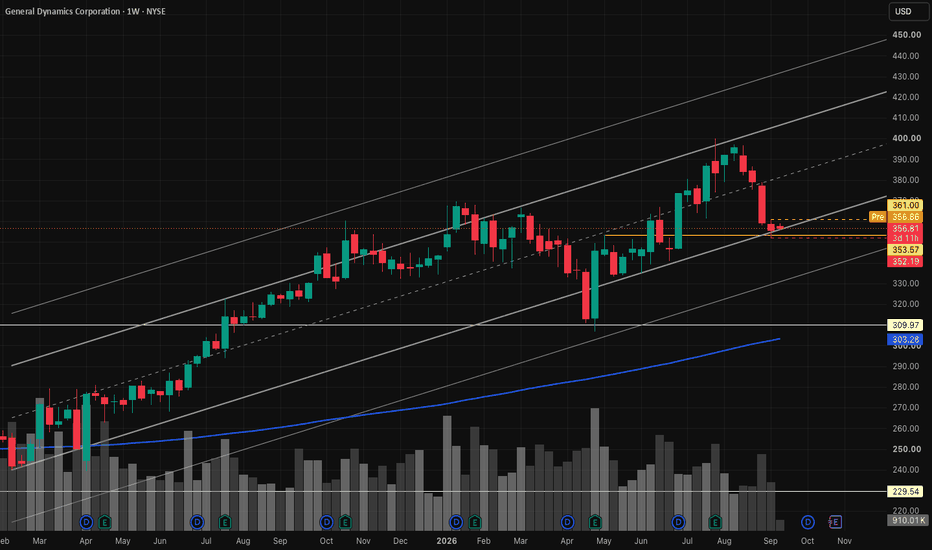
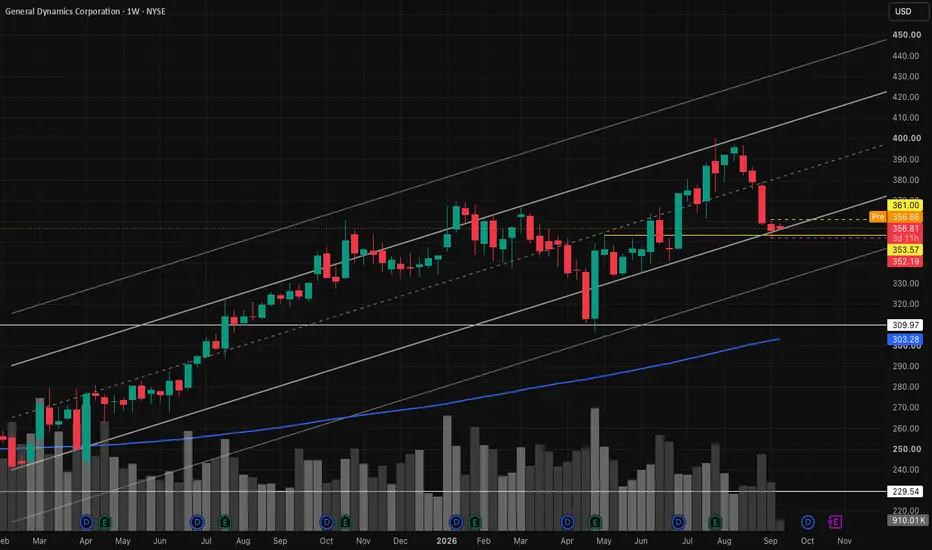
GD | Continued stock growth- Timeframe: Weekly
- Trade type: Buy stop order
- Price: 361.00
- Take Profit: Open
- Stop Loss: 352.19 (-2.40 %)
Idea: Long on a breakout above last week's high - bullish momentum continuation.
Entry: Buy stop above last week’s high.
Stop-loss: Below the low of the same candle.
If the weekly candle closes below this level, the trade is invalidated.
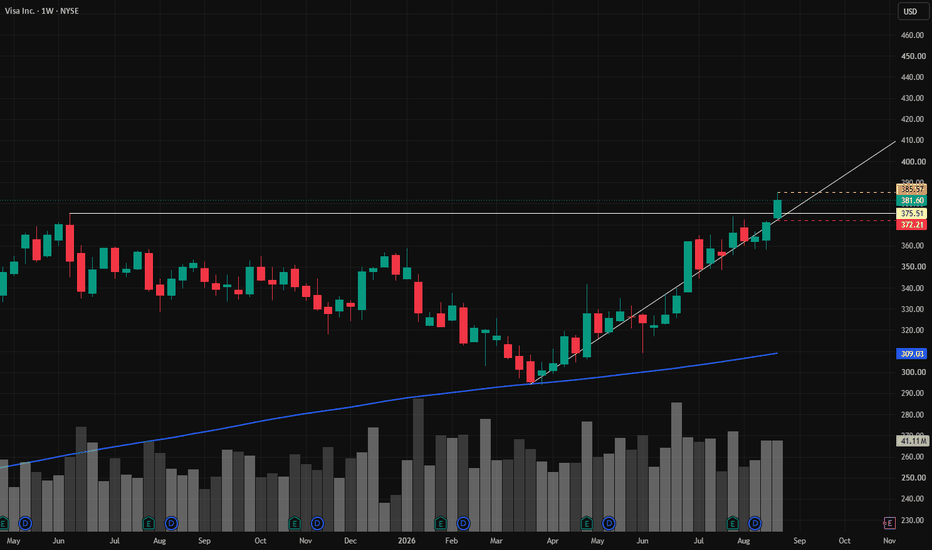
VISA | Continued stock growth- Timeframe: Weekly
- Trade type: Buy stop order
- Price: 385.57
- Take Profit: Open
- Stop Loss: 372.21 (-3.50 %)
Idea: Long on a breakout above last week's high - bullish momentum continuation.
Entry: Buy stop above last week’s high.
Stop-loss: Below the low of the same candle.
If the weekly candle closes below this level, the trade is invalidated.
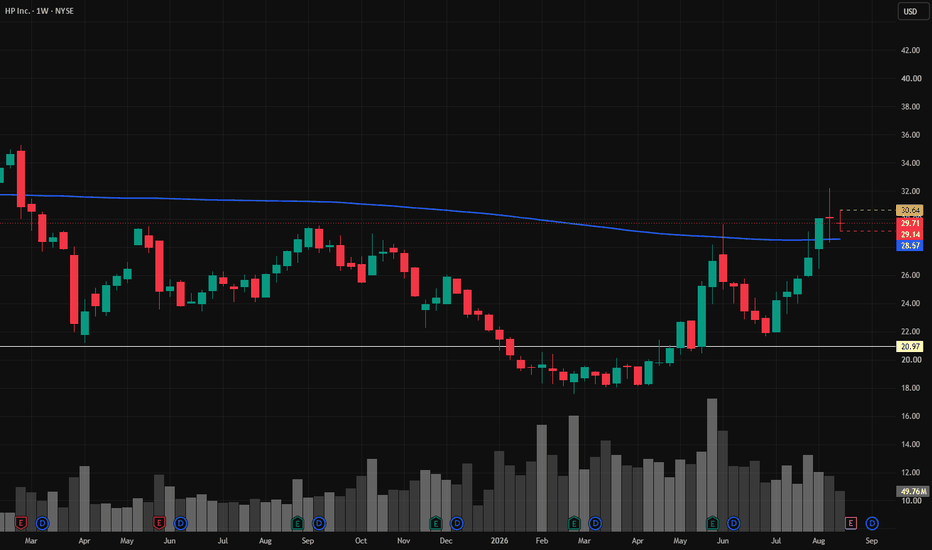
HPQ | Continued stock growth- Timeframe: Weekly
- Trade type: Buy stop order
- Price: 30.64
- Take Profit: Open
- Stop Loss: 29.14 (-4.90 %)
Idea: Long on a breakout above last week's high - bullish momentum continuation.
Entry: Buy stop above last week’s high.
Stop-loss: Below the low of the same candle.
If the weekly candle closes below this level, the trade is invalidated.
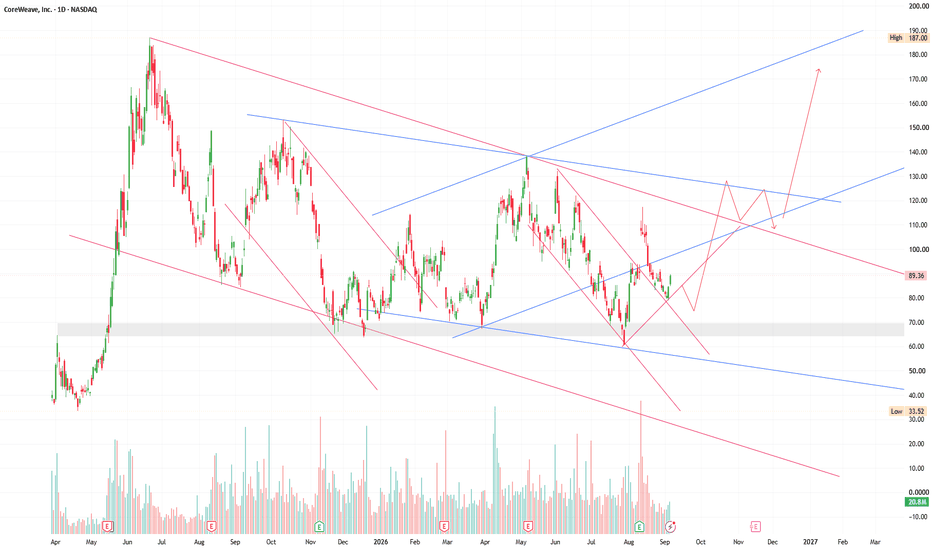
CRWV Analysis RequestOf course if someone asks for advice on trendlines, I go through my entire methodology of trendline trading, how I tell the story of the chart through these algorithms, and how I utilize these "lines" to identify liquidity and what price is respecting at any given time and what it needs to do in order to maintain healthy price action in the direction we're looking.
But... I don't think that's what the request was for. Whoops. Good video anyway.
Man, I love charts.
Happy Trading C Man :)
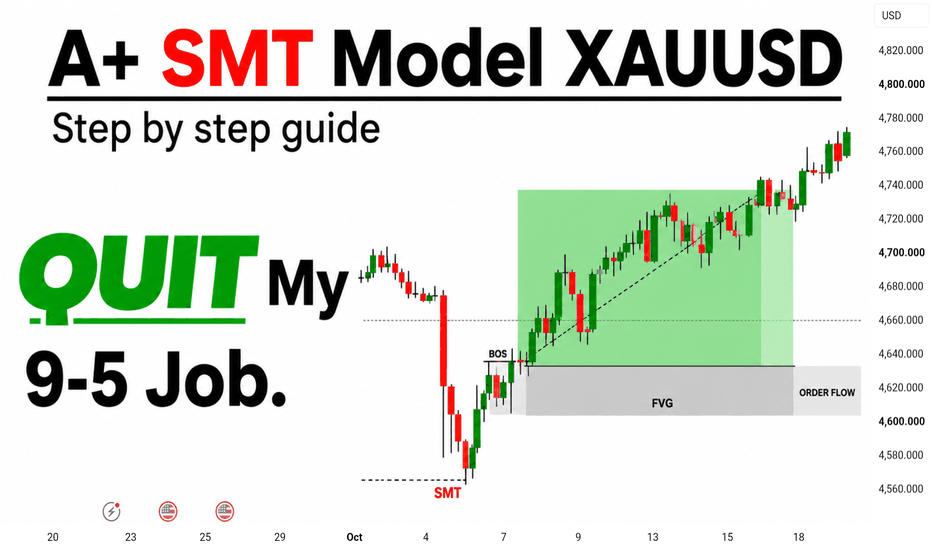
XAUUSD — A+ SMT Model | Liquidity & FVG Framework.
A structured XAUUSD bullish setup based on liquidity sweep, SMT divergence, market structure shift, displacement, and Fair Value Gap (FVG) confirmation. The model focuses on waiting for clear price-action confirmation before considering execution, with defined risk and invalidation.
This analysis presents a structured A+ SMT model for XAUUSD, combining liquidity concepts, market structure, displacement, and Fair Value Gap analysis to identify a potential bullish continuation scenario.
The setup begins with a sell-side liquidity sweep, where price trades below a previous low and collects available liquidity. Following the sweep, an SMT divergence provides additional confirmation that momentum may be shifting.
Price then produces a clear bullish displacement, indicating stronger buying pressure and a potential market structure shift (MSS). The displacement creates an identifiable Fair Value Gap (FVG), which is marked as a potential area of interest for a retracement.
The analysis also considers the surrounding order-flow zone. If price respects this area and maintains bullish structure, continuation toward higher liquidity and previous structural highs becomes a potential scenario.
Model Sequence
Liquidity Sweep → SMT Divergence → Market Structure Shift → Bullish Displacement → FVG → Retest → Continuation
The key principle is confirmation over anticipation. An SMT signal alone should not be treated as an entry trigger. Market structure, displacement, liquidity behavior, and the reaction from the FVG should be evaluated together.
Risk Management
Every trade should have a clearly defined invalidation level, controlled position size, and predetermined risk. Market conditions can change rapidly, particularly on XAUUSD, so the setup should be reassessed if the underlying structure becomes invalid.
Educational market analysis only. No setup guarantees a specific outcome.
Bitcoin: Parabolic Acceleration or Building a Base?Hello traders! 🌴☀️
Timing is everything)
Yesterday at 01:15 NY time, just two hours before Bitcoin exploded from $81K to $87,397, I published a post warning you that the technical picture was looking very bullish 🦬🚀
“Yes, we have not reached the projected target of $82.5K yet, but we have already printed a local high at $81,087, established a new trading range above $80K, reacted strongly from the newly formed ascending trendline, and continue to pressure the $82K level from below.
All of these technical factors strengthen the bullish scenario today.”
I also outlined the main bullish scenario:
“If Bitcoin holds the $80K and $81K levels today until the US session opens, I expect the upward move to continue toward the projected target of $82.5K and potentially further toward $84K.”
Both targets — $82.5K ✅ and $84K ✅ — have now been reached, in line with the bullish scenario outlined in my recent posts.
Congratulations to the bulls on this move. The $80K level certainly put up a serious fight ✊🏼🦬🏋🏽
What’s happening on the chart right now?
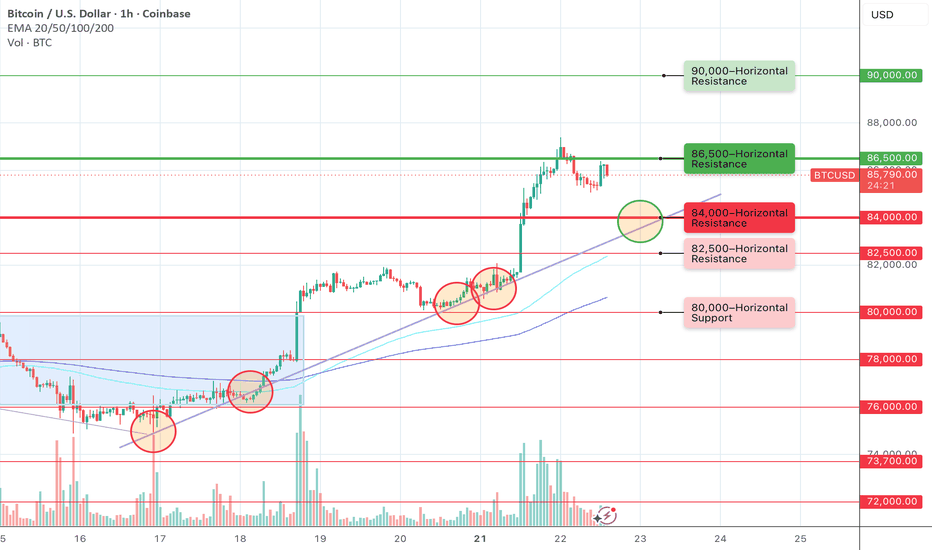
The $82.5K and $84K levels were taken out without much hesitation, and the first meaningful resistance has appeared only now, around $86.5K.
Similar to yesterday’s compression below $82.5K, Bitcoin is now pressing against $86.5K from below.
🦬🚀 Bullish Scenario.
If this compression continues until the US session opens, we could see another attack on $86.5K today.
If Bitcoin breaks and holds above this level, the path toward $90K looks relatively open.
Between $86.5K and $90K, I currently don’t see any major technical levels that could significantly slow the move.
However, it is very important to understand that such a parabolic move is not technically healthy and is extremely difficult to predict
From a technical perspective, I would actually prefer to see either a small correction toward $84K, into the ascending trendline (green circle on the chart), or several days of consolidation around current levels.
That would create a stronger technical foundation, and the next leg higher would look much healthier.
But that’s what I would like to see — the chart itself is currently showing a parabolic move that may still be in its early stages.
🐻🪓 Bearish Scenario.
For the bears to take back the initiative, Bitcoin would first need to lose the local ascending trendline around $84K.
That alone would not be a critical signal.
We would then need to see a consecutive breakdown of the $82.5K and $80K horizontal levels.
The latter will likely be particularly difficult, considering how long $80K acted as resistance and how hard the bulls fought to establish acceptance above it.
Only a breakdown and sustained move back below $80K would signal a potential return to the previous $76K–$80K trading range, with the lower boundary around $76K becoming the next major area of interest.
Peace 🌄
⚠️ Disclaimer:
All information shared on this channel is for educational and informational purposes only and is not investment advice. The author is not responsible for your trading decisions. Always manage your risk and make decisions independently.
XAUUSD — Wave 5 Lower Toward 4,280
From Kelly’s view, gold is still trading inside a broader bearish structure. Price is currently around 4,352, while the recent rebound remains below the previous lower-high area near 4,380–4,395.
The key idea is simple: the current move may be completing a corrective Wave (4) around resistance, while the main structure still favors another bearish leg toward 4,320, 4,305, and potentially the 4,280 Wave (5) target zone.
⟡ Market structure
Gold continues to show a sequence of lower highs after failing around the 4,390 area.
The immediate resistance zone sits around 4,340–4,350, where the chart marks the projected Wave (4) sell zone. Price is currently testing this area, so the next reaction becomes important.
If sellers defend this zone and price breaks back below 4,320, bearish momentum could strengthen.
The 4,305 level is the next structural support. A confirmed breakdown below this level may expose the 4,278–4,288 area, where the projected Wave (5) completion and Fibonacci extension overlap.
➤ Key levels
◌ Current price area: 4,350–4,355
◌ Main sell zone: 4,340–4,350
◌ Strong resistance: 4,380–4,395
◌ First support: 4,318–4,325
◌ Strong support: 4,305
◌ First target: 4,320
◌ Second target: 4,305
◌ Main target: 4,278–4,288
◌ Invalidation: Above 4,395
⌁ Elliott Wave view
Wave (1): The first bearish impulse started from the recent local high and pushed price lower.
Wave (2): Gold produced a corrective rebound before sellers returned.
Wave (3): The next bearish leg extended toward the 4,320 area.
Wave (4): Price is now attempting another corrective recovery toward the 4,340–4,350 resistance zone.
Wave (5): If sellers reject this area, the final bearish leg could extend below 4,305 toward the 4,278–4,288 completion zone.
▸ Trading scenario
Preferred bearish scenario
Entry: 4,340–4,350 after bearish confirmation
Stop Loss: Above 4,395
Take Profit 1: 4,320
Take Profit 2: 4,305
Take Profit 3: 4,278–4,288
The cleaner plan is to wait for rejection around the projected Wave (4) resistance area. A break below 4,320, followed by loss of 4,305, would strengthen the continuation toward the Wave (5) target.
Alternative scenario:
If gold breaks above 4,350 and holds with strong bullish momentum, price could retest 4,380–4,395 before the broader bearish structure is reassessed.
◌ Invalidation
The bearish scenario would weaken if price gains sustained acceptance above 4,380, while a confirmed break above 4,395 would invalidate the preferred Wave (5) continuation setup.
⌁ Kelly’s view
Kelly’s main view remains bearish while gold stays below 4,380–4,395.
The current rebound looks more like a corrective Wave (4) than a confirmed trend reversal. If sellers defend 4,340–4,350, the next downside sequence may target 4,320, then 4,305, before the larger 4,278–4,288 Wave (5) zone comes into focus.
Do you think sellers will defend the Wave (4) zone, or will gold retest 4,390 first?
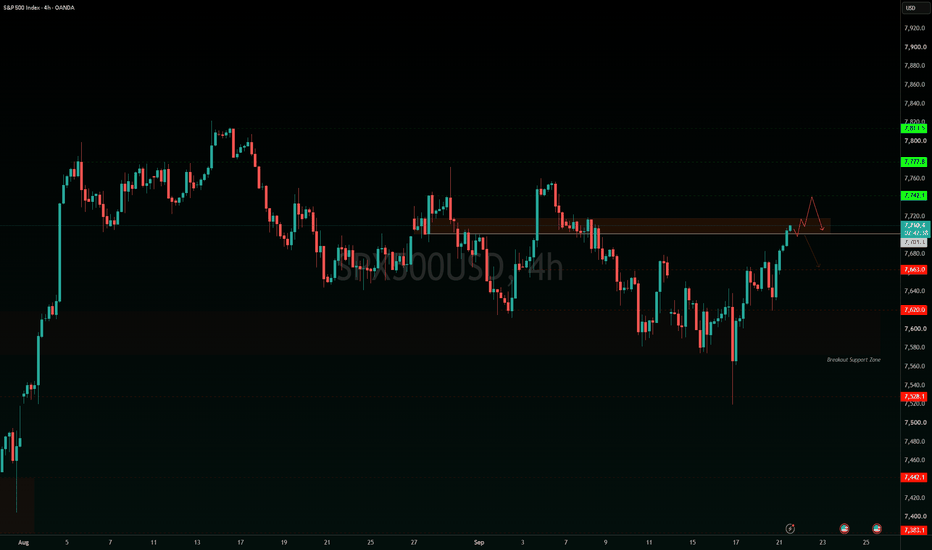
SPX500 | Bulls Eye 7742 as Momentum Holds Above 7701
SPX500 continues to show bullish pressure, with buyers currently targeting the 7718–7720 area as the next short-term resistance.
The broader fundamental environment remains supportive as investors focus on the upcoming Trump–Xi summit, while easing oil prices continue to reduce some inflation pressure. However, geopolitical developments in the Middle East remain an important volatility risk.
Technically
As long as SPX500 maintains stability above the 7701 pivot, bullish momentum remains active toward 7718–7720.
A confirmed 1H candle close above 7720 would strengthen the bullish move toward 7742. After reaching 7742, the index could enter a consolidation phase between 7720 and 7742 before establishing its next direction.
A further breakout above 7742 would open the way toward the next major resistance at 7777.
On the downside, a confirmed 4H candle close below 7701 would weaken the bullish structure and shift momentum bearish, initially exposing 7678, followed by 7663.
Pivot Line: 7701
Resistance: 7720 – 7742 – 7777
Support: 7678 – 7663 – 7620
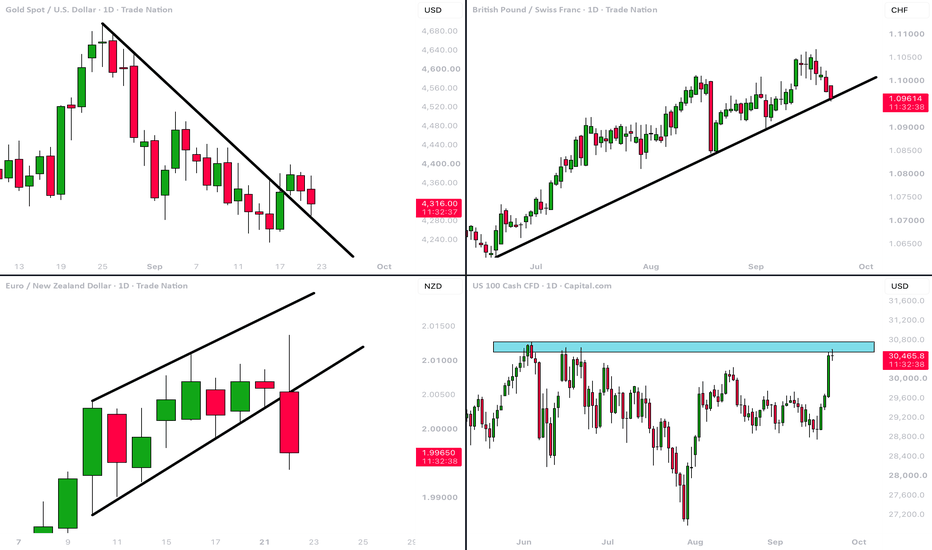
MarketBreakdown | GOLD, GBPCHF, EURNZD, US100
Here are the updates & outlook for multiple instruments in my watch list.
1️⃣ #GOLD #XAUUSD daily time frame 🥇
The price is currently retesting a recently broken falling trend line.
It acts as a strong vertical support.
I expect a pullback from that.
2️⃣ #GBPCHF daily time frame 🇬🇧🇨🇭
The market is trading in an uptrend.
The price is testing a major rising trend line based on the higher lows.
With a high probability, another bullish wave will start from that.
Alternatively, its breakout will trigger a strong selling reaction.
3️⃣ #EURNZD daily time frame 🇪🇺🇳🇿
The price is currently breaking a support line of a rising wedge pattern.
It indicates an overbought state of the market.
The price will likely continue retracing.
4️⃣ #NASDAQ Index #US100 daily time frame 🇺🇸
The market is testing a resistance cluster based on the current ATH.
Taking into consideration the current sentiment, odds are high that it will be broken soon.
A daily candle close above the underlined area will provide a strong signal to buy.
Do you agree with my market breakdown?
❤️Please, support my work with like, thank you!❤️
I am part of Trade Nation's Influencer program and receive a monthly fee for using their TradingView charts in my analysis.
GBPUSD | Liquidity Sweep at 1.3400 Intraday Bearish ContinuationGBPUSD is testing the 1.3400 psychological resistance level following a liquidity sweep above both Friday's high and the previous day's high, creating a key area of potential supply. The previous week also declined by approximately 192 pips, exceeding three times the pair's average daily range, suggesting downside momentum may be becoming increasingly extended. With Asia producing an average-sized range of around 20 pips, conditions remain favourable for a potential New York session reversal. I am now waiting for the current liquidity sweep candle to close alongside bearish momentum confirmation on the TDI, with the RSI crossing back beneath its slower signal line before considering an entry. My initial objective is a move towards the Beginning of Week Range Low (1.33740), with the Previous Week Low (1.33360) acting as the secondary downside target should bearish momentum continue. The thesis will be invalidated if price produces a 1-hour close above 1.34250. This remains an intraday liquidity-driven setup rather than a broader macro directional view, with confirmation taking priority over anticipation.
Euro Buyers Step In at Support — Next Target 1.1540 Seller ZoneHello traders! Here’s my technical outlook based on the current EURUSD (1H) chart structure. EURUSD previously traded inside a descending structure before forming a range near the Seller Zone. Price then broke lower, tested the Buyer Zone, and bounced, showing signs of buyers defending support. Currently, EURUSD is trading below the 1.1540 Seller Zone while holding above the 1.1470 Buyer Zone and Support Line. The recent bounce from support suggests buyers are preparing for another move higher. As long as EURUSD remains above the 1.1470 Buyer Zone and respects the ascending Support Line, the bullish scenario remains valid. A continuation higher could push price toward the 1.1540 Seller Zone (TP1). However, a breakdown and close below the Buyer Zone would weaken the bullish outlook and increase the possibility of further downside. Please share this idea with your friends and click "Boost" 🚀