AMD – Bronze Accepted After Correction | Why CSE Chose SharesDate: 2026-09-15
Type: CSE Option Decision OS Update
AMD is currently one of the most interesting live cases inside our CSE Capital — Option Decision OS, also known as the Continuation Swing Engine.
Over the last two days, AMD gave us exactly the kind of situation where a normal trader can easily become emotional. The stock corrected sharply, volatility increased, and the question immediately became: is this weakness a warning, or is this a structured entry opportunity?
This is where our CSE decision tree becomes valuable.
Yesterday, during the correction, AMD moved into our Bronze Current Entry Frontier. The dashboard had already defined the Bronze range between 461.87 and 485.00, with the function labelled as BREAKOUT_ACCEPTED. That meant the correction was not automatically bearish. It brought AMD back into a relevant CSE decision zone.
That is why we chose to initiate a small share position first.
Not options.
Not a full aggressive add.
Not a blind buy signal.
A controlled share position.
The reason is important. AMD is structurally interesting, but CSE does not classify the current setup as fully order-ready. The system currently shows:
Manual Action: HOLD / ADD WATCH
Underlying Thesis: THESIS INTACT
Tactical Status: TACTICAL REPAIR RECLAIMED
Add Status: EVALUATE RANGE — FEASIBILITY REQUIRED
Option Position: HOLD
Signal Confidence: 75/100
Decision Price / Current Quote: 504.24
Trend: Bullish
Next Zone: 580.91
Invalidation: 291.26
Decision Mode: Manual Only
Execution: Locked / Disabled
This is exactly the distinction we want the CSE Option Decision OS to make.
The dashboard is bullish on trend and intact on thesis, but it is not saying “auto buy.” The system recognises that AMD has accepted the Bronze range, reclaimed tactical repair, and remains in a bullish continuation structure. At the same time, it keeps the decision disciplined by showing “Evaluate Range — Feasibility Required.”
That is why shares made more sense first than options.
With shares, we can participate in the thesis while keeping the position flexible. With options, the decision has to be much stricter: premium, liquidity, bid/ask spread, expiry, delta, implied volatility, concentration risk and total portfolio exposure all need to pass the CSE Option Feasibility + Risk Gate.
AMD’s Macro Fib Thesis Lens also supports the broader case:
Position Archetype: Bullish Continuation
Macro Fib Status: Certified Structural Thesis — Intact
Macro Survival Support: 359.62
Tactical Repair Trigger: 456.94
Distance to Macro Support: +40.2%
Distance to Repair Trigger: +10.4%
Decision Posture: Evaluate Range — Feasibility Required
Reclaim Required: False
No Add Zone: False
Order Ready: False
That combination is powerful, but also nuanced.
The thesis is intact.
The trend is bullish.
The tactical repair has been reclaimed.
The Bronze range has been accepted.
But the setup still requires feasibility review before any option decision.
This is exactly how we want to use CSE Capital — Option Decision OS. It is not built to generate random buy and sell signals. It is built to create a structured decision framework around Fibonacci architecture, tactical repair, entry frontiers, thesis health, option feasibility and portfolio impact.
The current AMD roadmap now points to 580.91 as the next major CSE target zone, with higher structural zones at 738.48 and 938.92. These are not guarantees or predictions. They are roadmap levels inside the model. The purpose is not to claim certainty, but to know where the next decision areas are before price gets there.
The most important part of this AMD case is the process.
Yesterday’s correction did not make us panic.
It made us measure AMD against the dashboard.
The dashboard showed Bronze Accepted.
The thesis remained intact.
The trend stayed bullish.
The tactical repair remained reclaimed.
But CSE still required feasibility review.
So the decision was: start with shares as controlled exposure, keep options under review, and do not chase.
That is the edge we are trying to build.
Not prediction.
Not hype.
Not emotional trading.
A structured decision system for options and equity exposure.
Structure first.
Confirmation second.
Feasibility third.
No chase, no emotion, only process.
 Long
Long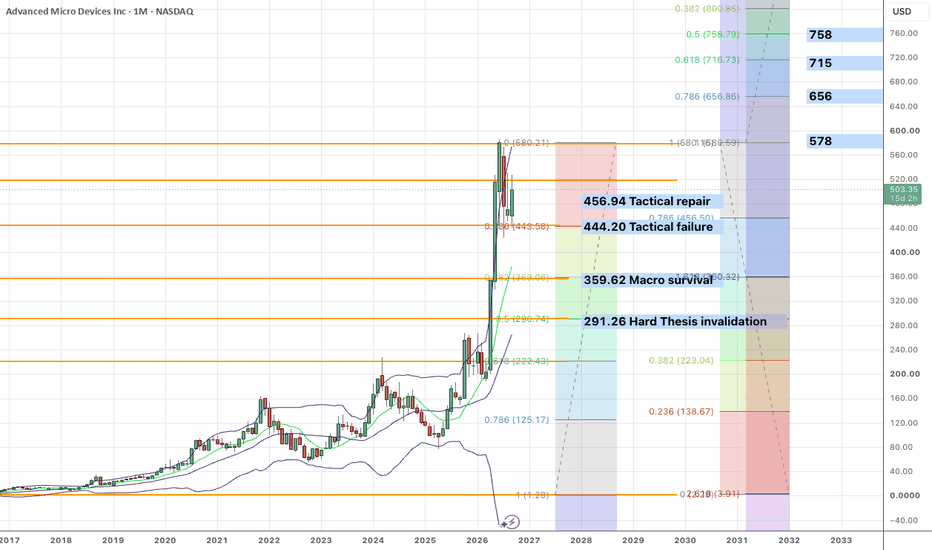
 Short
Short
 Short
Short
 Short
Short
XAUUSD 1H: Descending Channel Continuation SetupTechnical Overview:
Gold (XAUUSD) 1-Hour timeframe par ek clear Descending Channel ke andar trade kar raha hai. Overall price action bearish trend ko continue kar raha hai aur resistance levels se rejection dekhne ko mil rahi hai.
Key Levels to Watch:
Resistance / Stop Loss Zone: 4,360 - 4,365 area ke paas strong resistance majood hai.
1st Target Area: 4,280 (Support Line / Key Pullback level)
2nd Target Area: 4,240
Final Target Area: 4,200 (Lower Channel Boundary)
Trade Idea & Execution Plan:
Price abhi upper trendline resistance ke qareeb react kar rahi hai. Agar breakout nahi hota aur rejection continue rehti hai, toh breakdown ke baad target zones ki taraf move expect ki ja sakti hai:
First retest ke baad 4,280 tak short-term move.
4,280 ke neeche continuous pressure se price 4,240 aur phir final support 4,200 tak slide kar sakti hai.
TradingView post ki visibility aur reach barhane ke liye yeh hashtags use karein:
#XAUUSD #GoldAnalysis #ForexTrading #TechnicalAnalysis #PriceAction #TradingSetup #ForexMarket #TradingView  Long
Long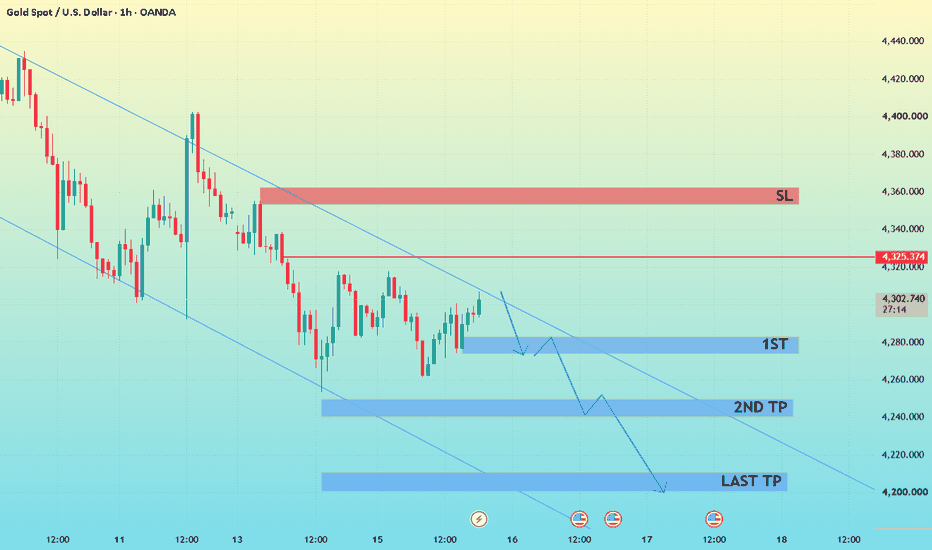
WTI Crude Oil (1D): $106 Breakout & Textbook ABC ImpulseTitle: WTI Crude Oil (1D): $106 Breakout & Textbook ABC Impulse Toward $120+ 🛢️🚀
🧠 Fundamental Overview (Geopolitical Spike & Macro Supply Shock):
WTI Crude Oil (SPOT) has exploded higher, pushing past the critical $105–$106/bbl threshold to trade at its highest levels since early May. The rally is heavily backed by severe supply disruptions and escalating geopolitical tensions:
Geopolitical Escalation & Supply Risk: Following renewed drone strikes in the Middle East that shut down critical infrastructure—including Saudi Arabia's East-West pipeline—and intensified maritime friction around the Bab al-Mandab strait and the Strait of Hormuz, the supply risk premium has expanded aggressively.
Inflationary Spillover: As highlighted by The Kobeissi Letter, U.S. crude prices are up over +57% since July 2nd , pushing average retail gasoline prices up to $4.33/gallon . WTI is now sitting roughly 13% away from the peaks reached at the onset of the conflict, directly stoking global stagflation and interest rate worries.
📊 Technical Breakdown (1D Timeframe):
On the daily chart, price action is unfolding a textbook bullish ABC impulse off the multi-month ascending baseline:
1️⃣ Confirmed ABC Wave Structure & Dynamic Reclaim:
After an initial impulse to the $102.45 peak (Wave A), the corrective Wave (B) bottomed within a deep retracement between the 61.8% ($91.97) and 78.6% Fibonacci levels, briefly testing the rising macro Trendline B around $75.22. From that floor, the market triggered an aggressive Wave (C) expansion that cleanly sliced through the 50-day EMA ($88.35) , the 200-day EMA ($82.22) , and descending Trendline A —a dynamic diagonal ceiling that had contained every rally attempt for months.
2️⃣ Volume Expansion:
The last two daily sessions have recorded a noticeable volume spike (reaching ~86.97k ticks), proving heavy institutional participation driving this breakout rather than a low-volume liquidity squeeze.
3️⃣ MACD Convergence:
The daily MACD exhibits total directional alignment with price action—printing expanding green histogram bars and an aggressive bullish crossover without showing technical overbought exhaustion yet.
4️⃣ Fibonacci Extension Targets:
Target A (1.618 Fib Extension / Macro Ceiling): $119.40 – $120.00 USD (Direct confluence of the 1.618 Fib extension and the previous macro highs).
Target B (2.000 Fib Extension): $129.88 USD (Full measured impulse expansion).
🎯 Conclusion & Trading Strategy:
The technical structure is decisively bullish, pointing straight toward the macro resistance block at $120 USD.
However, from an execution standpoint, chasing fresh long positions right here at $106.75 means entering late with unfavorable asymmetry. The optimal entries were either:
Aggressive Entry: Directly in the 61.8%–78.6% Fib reversal zone ($75–$78).
Conservative Confirmation: On the breakout above both EMAs and Trendline A around $83–$84 USD.
At current levels, price is only about 10% away from its major macro target, while the downside exposure on a sharp mean-reversion is wide. A local pause or corrective pullback near the intermediate $109–$110 supply zone to digest gains would be healthy before attempting the final push to $120. If such a pullback occurs, watch closely for fading volume and potential oscillator divergences to gauge whether it is a continuation flag or a deeper reversal.
Are you trailing profits toward $120 or looking to short the extension? Let's discuss in the comments! 👇
⚠️ Disclaimer: This analysis is strictly for educational purposes and intended solely to intellectually enrich our trading community. It does NOT constitute financial or investment advice. Always perform your own research and manage your risk strictly.  Long
Long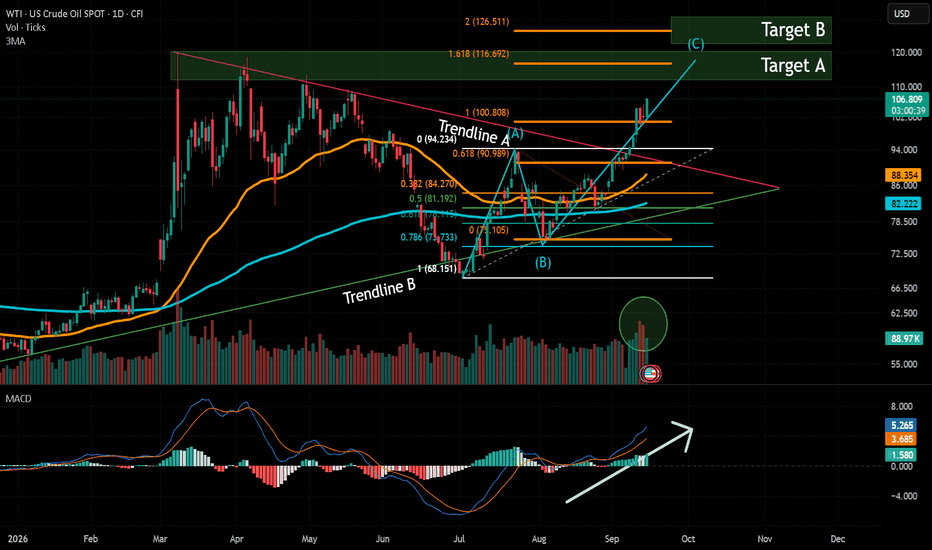
 Short
Short
 Long
Long
 Long
Long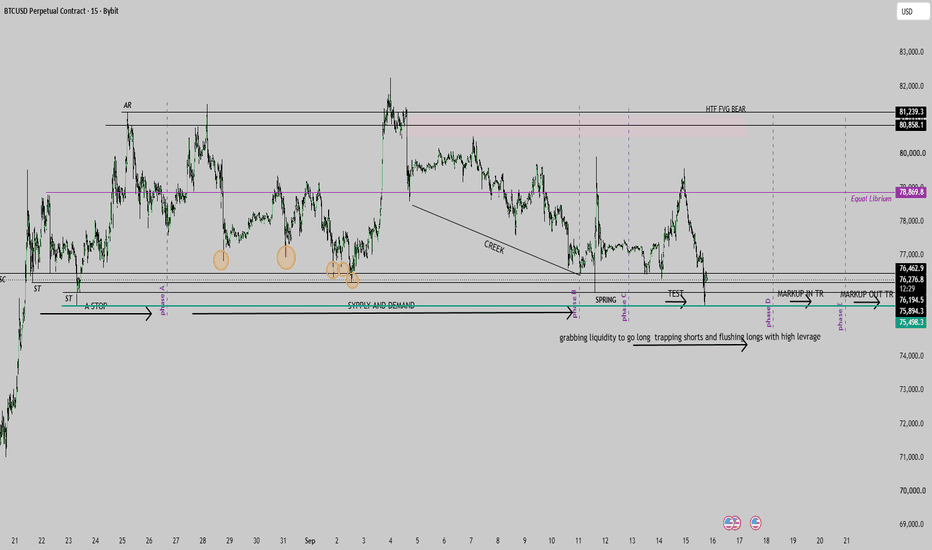
 Short
Short
 Long
Long
Short 
Bitcoin — $76K Decision: Recovery or Breakdown?₿ Bitcoin has been trading inside a broad range after the previous recovery, but the latest rejection from the upper part of the structure has pushed price back toward a major demand zone.
Price is now testing the lower edge of the range around the $75,500–$76,500 area. This is a critical decision point: holding it could trigger another recovery, while a clean breakdown would expose the deeper kink zones below.
🏆 Previously:
📈 Bullish scenario
The current zone around $75,500–$76,500 is the main area buyers need to defend. Price has repeatedly reacted around this region, making it an important base for another potential recovery.
If BTC holds this zone and starts reclaiming the nearby range, the first major target would be the upper resistance around $82,000–$82,800. A clean breakout above that zone could open the door for another bullish expansion.
Demand hold → range reclaim → $82K+ breakout watch.
📉 Bearish scenario
The immediate risk is a confirmed breakdown below $75,500, which would weaken the current range structure and suggest that sellers are taking control.
If the breakdown continues, the first major area below is the $71,100–$72,000 kink. Losing that zone could expose the next kink around $69,000–$69,700, creating room for a much deeper bearish move.
$75.5K breakdown → $72K kink → $69K test.
🎯 Outlook
Bitcoin is sitting directly on a major decision zone after being rejected from the upper part of the range. The $75,500–$76,500 area is now the key defense for the bulls.
Holding this zone keeps the recovery scenario alive and puts $82,000–$82,800 back in focus. But if BTC loses the zone decisively, the $71,100–$72,000 kink becomes the next major area to watch.
Hold $75.5K–$76.5K → bullish recovery remains possible.
Reclaim the range → $82K–$82.8K becomes the next target.
Break below $75.5K → deeper downside opens up.
Zone test → reaction → $82K breakout or $72K breakdown. Gold — Quiet Structure, Loud Move Ahead?🥇Gold has been moving sideways after the previous bearish pressure, with price now consolidating inside a clearly defined short-term range.
The current structure is sitting directly around a major demand zone, while the upper zone remains the key resistance area. This creates a clean decision point between a bullish recovery and another bearish expansion.
🏆 Previously:
📈 Bullish scenario
Buyers are still defending the lower zone, and the recent reactions show that this area remains important. If Gold can hold the current structure and push through the upper side of the range, momentum could shift back toward the bulls.
A clean breakout above the marked resistance zone would confirm the recovery and open the way toward the next major upside area.
Range breakout → zone reclaim → bullish expansion.
📉 Bearish scenario
The current sideways structure can also become a continuation pattern if buyers fail to reclaim the upper zone. Repeated rejection from the range highs would keep sellers in control of the broader structure.
If the lower demand zone breaks, the current consolidation could resolve sharply to the downside, bringing the next lower zone into focus.
Range rejection → demand breakdown → bearish expansion.
🎯 Outlook
Gold is currently trapped between a strong lower demand area and a major resistance zone. The market is compressing, and the next clean breakout should provide the stronger directional signal.
For the bulls, the key is breaking the upper zone. For the bears, losing the current demand zone would be the confirmation they need.
Hold the demand zone → recovery remains possible.
Break the upper zone → further upside opens up.
Lose the lower zone → deeper downside becomes likely.
Sideways compression → breakout → next expansion.