GOLD 4H: Retest of Falling Wedge & Trendline Support for LONGOverview
Technical Analysis
Market Structure & Trend: On the 4-hour timeframe, Gold (XAU/USD) remains in a overall macro bullish structure, defined by a major multi-month Ascending Trendline originating from below $4,000.
Chart Pattern: After reaching peak liquidity near the major overhead Resistance Zone ($4,580 – $4,600), price underwent a corrective pullback. This correction formed a classical Falling Wedge Formation, which recently broke out to the upside.
Key Support Confluence (Buy Zone): The price is currently pulling back to retest the confluence of:
Broken upper boundary of the falling wedge.
Horizontal Strong Support Zone ($4,230 – $4,260).
The primary Ascending Trendline dynamic support.
Trade Setup:
Entry Area: $4,230 – $4,260 (Optimal Risk-to-Reward buy zone on bullish confirmation).
Targets: First target at major swing resistance $4,444, followed by ultimate resistance near $4,583.
Invalidation: A clean 4-hour candle close below the ascending trendline and $4,200 invalidates this bullish scenario.
Fundamental Drivers
Federal Reserve Monetary Policy: Following the September 2026 FOMC meeting where the Fed raised rates by 25 bps to 3.75%–4.00%, short-term yields surged, causing a temporary dip in non-yielding bullion. However, sticky headline CPI and energy costs keep gold heavily cushioned as an inflation hedge.
Macro Uncertainty & Geopolitics: Continued geopolitical tensions in the Middle East and energy supply concerns continue to drive safe-haven allocations into gold on pullbacks.
U.S. Fiscal Concerns: Persistently high U.S. national debt levels and elevated Treasury supply maintain underlying structural demand for real assets, backing long-term upside continuation.
Disclaimer
This post is strictly for educational purposes and reflects personal technical chart observations. It should not be taken as financial or investment advice. Always manage your risk according to your trading strategy.  Long
Long
 Long
Long
GBP/CHF Idea: Bullish Rebound at Key Demand ZoneTrading Overview
Direction: Long (Buy)
Entry Zone: $1.0990 - 1.1015
Target (TP): 1.10561 (Intermediate) / 1.11000 (Major Resistance)
Invalidation / Stop Loss (SL): Below 1.09000 (Clear break & close)
Technical Analysis
Trendline Confluence:
The price continues to respect a long-term ascending trendline extending from mid-August.
The recent pullback tested both the ascending trendline and horizontal support simultaneously, offering a high-confluence entry area.
Falling Wedge / Bull Flag Pattern:
Price action shows a sharp bullish breakout earlier in September, followed by a corrective falling wedge/channel.
The current price structure displays a minor curvature/rounding near the 1.0990–1.1015 zone, indicating seller exhaustion and early signs of a bullish reversal.
Key Horizontal Levels:
Major Support: $1.09900 - 1.09500 (Previous resistance turned support).
Key Resistance Targets: 1.10561 followed by the top supply zone at 1.11000.
Invalidation Zone: A clear candle break and close below 1.09000 invalidates the bullish structure and suggests a potential trend reversal.
Fundamental Context & Economic Drivers
Bank of England (BoE): The BoE maintained rates at 3.75% with a 6-3 vote split. Three committee members voted for a rate hike to 4.00%, highlighting persistent hawkish undertones due to energy and upside inflation risks. This hawkish tilt continues to support the British Pound (GBP).
Swiss National Bank (SNB): The SNB maintains low/negative real interest rates, keeping the CHF vulnerable to safe-haven liquidity outflows when market risk sentiment stabilizes.
Upcoming High-Impact Economic News
UK Flash Manufacturing & Services PMI (Wednesday, September 23, 2026): S&P Global will release the flash Purchasing Managers' Index data for the UK, which acts as an early indicator of economic activity and is expected to drive high volatility across all GBP pairs.
SNB Interest Rate Decision & Monetary Policy Assessment (Thursday, September 24, 2026): The Swiss National Bank will announce its quarterly interest rate policy and economic outlook, which is the most critical event of the week for CHF valuation and could trigger sharp movements in GBP/CHF.
UK Retail Sales Data (Friday, September 25, 2026): The UK Office for National Statistics will publish consumer spending figures, providing insight into domestic inflation pressures and potential guidance on future Bank of England rate decisions.
Trading Strategy & Risk Management
Confirmation: Look for a bullish reversal candle (e.g., 4H Hammer, Engulfing, or breakout of the micro falling trendline) inside the $1.0990 - 1.1015 demand zone before entering.
PNG
Risk/Reward Ratio: Approximately 1:2.5+ targeting 1.11000 with risk defined below 1.09000.
PNG
Disclaimer: This analysis is for educational and informational purposes only and does not constitute financial advice or a direct trading recommendation. Forex trading involves significant risk to your capital. Always use proper risk management and trade based on your own plan.
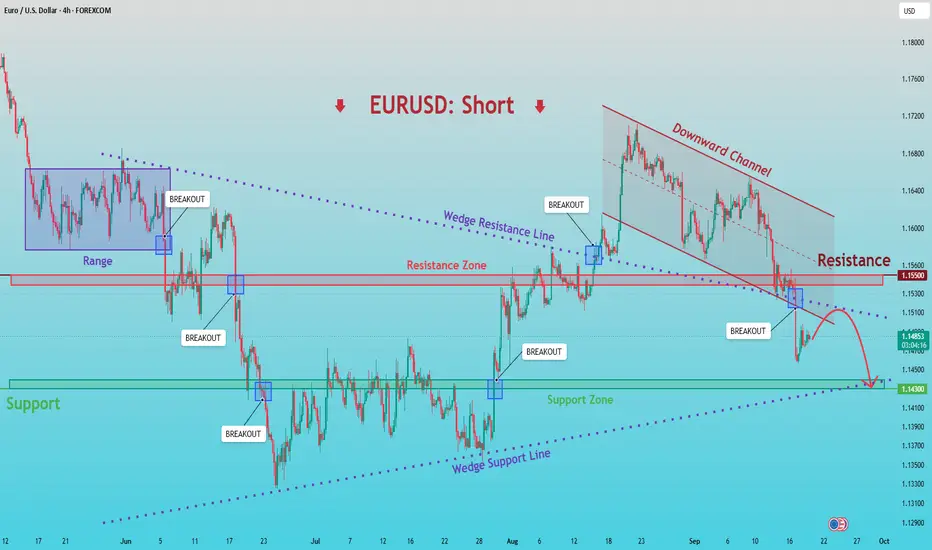
EURUSD: 4H Major Demand (SUP 78) Meets 1H Falling Wedge BreakoutEURUSD Technical & Order-Flow Analysis | 4H Tactical · 1H Trigger
━━━━━━━━━━━━━━━━━━━━━━━━━━━━━━━━━━━━━━━━━━━━
QUICK SPECIFICATIONS
━━━━━━━━━━━━━━━━━━━━━━━━━━━━━━━━━━━━━━━━━━━━
• Asset: EUR/USD (Spot FX)
• Bias: Tactical Bullish (Long / Mean Reversion)
• Entry Zone: 1.1478 – 1.1485
• Structural Invalidation (SL): 1.14470 (~35 pips)
• Target 1: 1.15000 (+18–20 Pips · First hurdle & BE trigger)
• Target 2: 1.15300 (+48–50 Pips · Tactical intermediate target)
• Target 3: 1.15550 (+72–75 Pips · Front-running major 124-touch wall)
• Risk / Reward: Up to 1 : 2.2
━━━━━━━━━━━━━━━━━━━━━━━━━━━━━━━━━━━━━━━━━━━━
1. THE MACRO PICTURE (4H): HISTORICAL DEMAND DEFENSE
━━━━━━━━━━━━━━━━━━━━━━━━━━━━━━━━━━━━━━━━━━━━
Following the 220-pip liquidation from the August high (1.1700), EURUSD has compressed into a multi-month institutional accumulation shelf:
• SUP 78 (29+ historical touches between 1.1465 and 1.1485)
• SUP 76 (21+ historical touches at 1.1455)
This price pocket has served as a reliable floor in March, May, and early August. Over the last 4 sessions, downside impulse momentum has noticeably flattened out, indicating sell-side exhaustion.
━━━━━━━━━━━━━━━━━━━━━━━━━━━━━━━━━━━━━━━━━━━━
2. TACTICAL CONFIRMATION (1H & 15M)
━━━━━━━━━━━━━━━━━━━━━━━━━━━━━━━━━━━━━━━━━━━━
While 4H establishes the location, lower timeframes provide the execution trigger:
1. Double-Bottom Liquidity Sweep:
Price tested 1.14550 on Sept 17 and retested it on Sept 18, printing long absorption wicks with zero follow-through breakdown.
2. Descending Wedge Breakout Confirmed:
• Market Regime: Descending Wedge (5.6 ATR span)
• Structure State: Bullish Break Confirmed
• Footprint Delta: +35% Aggressive Buyer Delta
3. 15M Trend Alignment:
The 15M execution frame has flipped into "Breakout Trend" with a series of higher lows (1.1455 → 1.1468 → 1.1475) and a 92% historical zone delivery rate.
━━━━━━━━━━━━━━━━━━━━━━━━━━━━━━━━━━━━━━━━━━━━
3. VOLUME REALITY CHECK: WHY WE ARE DISCIPLINED ON TP
━━━━━━━━━━━━━━━━━━━━━━━━━━━━━━━━━━━━━━━━━━━━
The Volume Radar on the 4H currently reads:
• Relative Volume: 0.35x average (QUIET)
• CVD Trend: Distributing
Because volume is currently quiet and overall 4H order flow remains cautious, we do NOT expect an immediate parabolic run to 1.1600+. Instead, we treat this as a high-probability mean-reversion bounce into overhead institutional supply walls:
• First Hurdle (1.15000): RES 67 sits right here, representing a breakdown level from Sept 16 (broken on a 2.3x volume spike). This is our first partial exit and where risk is reduced to zero.
• Major Ceiling (1.15550): The institutional wall at ★ RES 83 contains 124+ historical touches. We exit ahead of this level rather than hoping for a clean slice through.
━━━━━━━━━━━━━━━━━━━━━━━━━━━━━━━━━━━━━━━━━━━━
EXECUTION & RISK MANAGEMENT
━━━━━━━━━━━━━━━━━━━━━━━━━━━━━━━━━━━━━━━━━━━━
• Execution: Enter within 1.1478 – 1.1485.
• Invalidation: Clean 4H close below 1.14470 (violates both SUP 76 and the 1.14550 double-bottom trough).
• Management: Upon reaching 1.15000, secure 35%–40% profit and adjust stop loss to breakeven. Leave the remainder to run toward 1.1530 and 1.1555.
Trade your plan, manage your exposure, and respect market invalidation.
MESZ Sep 21: Trendline Break Above 7796 or Pullback to 7736?MESZ is trading around 7,764 after a strong overnight push, but price is now approaching an important descending higher-time-frame trendline.
The first pullback area I’m watching is around 7,736, where a fair value gap could attract price before the next directional move.
Below that, 7,714 is the next support area, while 7,674 remains the key higher-time-frame level protecting the broader bullish structure.
On the upside, 7,796 is the major confirmation level. A confirmed 1-hour close above that area would also represent a break through the descending trendline and could signal a more significant bullish structure change.
Key levels
7,736 — FVG / pullback zone
7,714 — deeper intraday support
7,674 — key HTF support
7,796 — bullish breakout confirmation
Bullish: defend 7,736 → retest trendline → break 7,796.
Bearish/pullback: lose 7,736 → watch 7,714 → 7,674.
Lower oil prices are also helping equity sentiment this morning, with WTI trading near $98.
Not financial advice. No confirmation, no trade. CME_MINI:MESZ2026  Long
Long
How I did a 1-week swing trade on BTC after a clear bullish flagAfter a 1-year downtrend on BTC, it finally broke out of a long-term descending trendline - this can be seen in a weekly chart if you zoom out.
BTC clearly started trending sideways like a bullish flag, which made me accumulate coins between Sep 8 and 17. I targeted my favourite coins at the moment personally - BTC, ETH, XRP, SOL, ADA, AVAX and QNT. My target of at least a 5% increase was achieved for all my trades.
In case you want to go deeper into technical analysis and my thought process:
1 - At first I spotted an ascending channel (blue rectangles)
2 - This channel started getting squeezed, forming a bullish pennant (black lines). This is when I started buying.
3 - When the pennant failed, I kept holding because there was a big support around 75-76k
4 - BTC could not close below 75500 even with bad news (clarity act), and it formed a falling wedge (yellow lines)
5 - BTC finally broke out, continuing its bullish trend since July 1st
6 - Now BTC is retesting 82k and most likely it will breakout
During these 3 patterns, all of them told me the same type of formation - BULLISH FLAG. In case you don't know, flags are not always descending like the textbook ones: they form in 3 directions - ascending, descending or flat.
Conclusion: BTC was clearly showing a bullish formation and it paid off.
I wish I could add pics or links to show the before and after but TradingView does not allow it. I hope you enjoyed it and please engage if you did!
 Long
Long
 Long
Long
 Long
Long
 Short
Short
 Short
Short
Bitfinex Sees 33,180 ETH Deposit from Long-Dormant WalletsTraders scanning the order books got a surprise when two wallets, likely belonging to the same whale, deposited 33,180 ETH into Bitfinex after more than two years of inactivity. This large transfer, valued at approximately $86.93 million, has sparked renewed interest in Ethereum among market participants. As a result, traders should closely monitor Ethereum’s network activity for potential shifts in sentiment and price trends.
Breaking It Down
The recent transfer of 33,180 ETH into Bitfinex has not only highlighted significant whale activity but also underscores a potential shift in market dynamics. This deposit, reported by the CryptoTwitter commentator @lookonchain, marks a notable reactivation of wallets that have been dormant for over two years. Given the current mixed signals in the broader crypto market, such movements may lead to increased scrutiny and speculation among traders regarding the future direction of Ethereum.
Ethereum, a leading smart contract platform, enables various decentralized applications and services within the blockchain ecosystem. Bitfinex, one of the largest cryptocurrency exchanges globally, plays a crucial role in facilitating trading and liquidity for Ethereum and other digital assets. The recent activity involving dormant wallets reactivating suggests possible strategic shifts within the Ethereum market, which traders should watch closely.
Key Levels to Watch
Traders are now on alert for further movements from this whale and any potential trends that may arise from increased trading volume on Bitfinex. The current dynamics could lead to heightened volatility in Ethereum’s price action, especially as traders assess the implications of this large transfer. Additionally, the reactivation of dormant wallets often indicates strategic repositioning, so ongoing monitoring of Ethereum’s on-chain metrics will be vital.
Market conditions are subject to change, and past performance is not indicative of future results.  Long
Long
 Long
Long
XAU/USD (Gold) 4H: Bullish Reversal at $4,254 SupportTechnical Analysis
Pattern Structure: On the 4-hour timeframe, Gold (XAU/USD) is completing a Falling Wedge / Descending Channel structure following a pullback from peak levels above $4,500.
Key Support Zone ($4,254 – $4,280): Price bounced directly off the major structural support demand zone (~$4,254). The lower boundary of the wedge aligns with this key historical level, forming a strong confluence zone.
Current Price Action: Gold is trading around $4,350, approaching the upper falling trendline resistance of the wedge pattern.
Trade Projection:
Pullback / Retest: A minor pullback toward the lower wedge boundary or $4,280–$4,300 zone is projected before a definitive breakout attempt.
Upside Target 1: Minor resistance region around $4,400.
Upside Target 2: Major resistance level at $4,481 – $4,500.
Fundamental Analysis
Central Bank & Real Yield Dynamics: Gold has rebounded above $4,300 as markets absorb recent macroeconomic developments, including Federal Reserve interest rate expectations and global central bank demand.
Inflation & Commodity Pressures: Elevated energy prices (crude oil firming near $100+) and ongoing structural inflation trends keep safe-haven demand intact.
Macro Backdrop: Safe-haven allocations and long-term debasement hedges continue to provide a solid baseline demand for precious metals despite short-term interest rate volatility.
Trade Parameters Summary
Level Price Level (USD) Notes
Primary Support $4,254.35 Major horizontal demand zone & wedge floor
Immediate Pivot / Entry Zone $4,280.00 – $4,320.00 Pullback buy zone / Trendline retest area
Intermediate Resistance $4,400.00 First structural supply zone
Major Target / Resistance $4,481.80 – $4,500.00 Primary pattern objective
Disclaimer
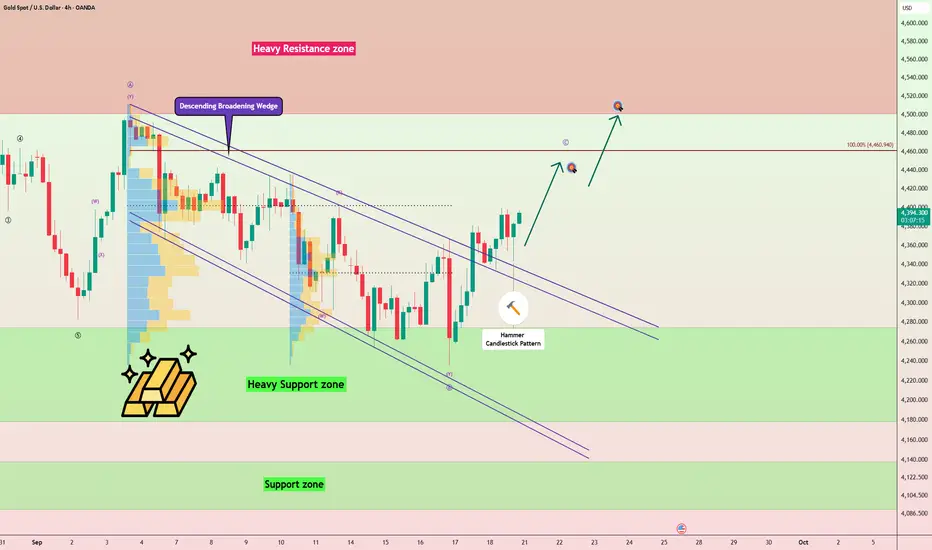
This analysis is strictly for educational and informational purposes only and does not constitute financial or investment advice. Trading Forex and precious metals involves significant risk of monetary loss. Always conduct your own research, use proper risk management, and consult a certified financial advisor before placing any live trades. Gold Breaks the Broadening Wedge — Is $4,500 Next?Gold ( OANDA:XAUUSD ) has successfully broken above the upper trendline of the Descending Broadening Wedge Pattern and is currently trading above the pattern.
This breakout could signal the beginning of another bullish move during the final trading hours of the week and potentially into next week.
Can gold confirm the breakout above $4,400 and extend its rally toward $4,487?
Technical Analysis
The breakout above the Descending Broadening Wedge suggests that bearish pressure may be weakening and buyers are attempting to regain control.
However, the key trading level of $4,400 remains important for confirming stronger bullish momentum.
💡 Educational Note: A breakout above a Descending Broadening Wedge can signal a bullish reversal, especially when price successfully holds above the broken upper trendline.
I expect gold to gain stronger bullish momentum after breaking above $4,400 and rise at least toward $4,443.
If bullish momentum increases, the move could extend toward $4,487.
Trade Setup
First Take Profit(TP): $4,443
Second Take Profit(TP): $4,487
Stop Loss(SL): $4,321(Worst)
Key Trading Levels: $4,330 _ $4,400
Which level do you think gold will reach first?
🟢 $4,487
🔴 $4,321
📌 Gold Analysis(XAUUSD), 4-hour time frame.
🛑 Always use proper risk management and set a Stop Loss(SL) for every position.
🚀 If this analysis helps your trading plan, a BOOST would help more traders discover it. Long 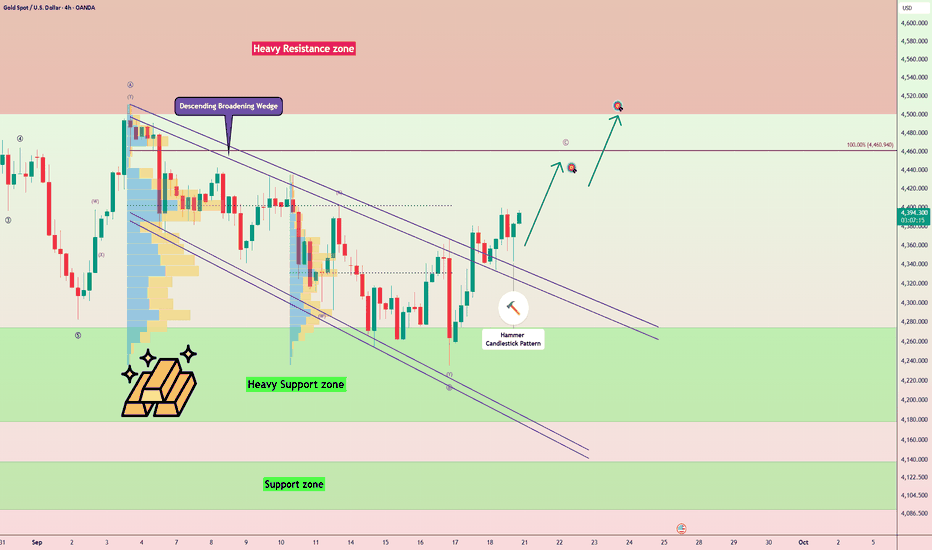
Long

ZETA | Weekly Structure | $38 Is the Next Key TestThesis:
ZETA continues to look constructive on the weekly chart. In my view, the stock is currently developing a Subwave 4 pullback within a larger Wave 3 structure. As long as price continues to hold in the $27-$29 area, I expect the next move to be a push toward the all-time-high resistance around $38. If that level is reclaimed, the longer-term structure continues to point much higher.
Context
- Weekly timeframe
- This is an update to my earlier ZETA view
- ZETA broke out of its bullish wedge in June, retested the breakout area from above and held
- That successful retest was followed by a strong move higher, helped by another strong earnings report
- Price is now consolidating after that impulsive advance
- My average entry and the one of my copiers is approximately $18.53
- Even after the recent move, I still view the stock as being in the middle of a larger bullish cycle rather than at the end of it
What I see
- The larger structure continues to look like Wave 3 is still in progress
- The current pullback fits well as a Subwave 4 correction within that larger move
- Price has already completed the breakout from the wedge and confirmed it with a retest
- That was an important technical development because it changed the character of the chart materially
- The current consolidation is happening above the breakout area, which is constructive
- The $27-$29 area is where I want to see support continue to hold
- The next major resistance is the all-time-high area around $38
- If that level breaks, the chart opens the door to the next higher-degree targets
What matters now
- $27-$29 is the key support area I am watching in the near term
- Holding that area keeps the current bullish structure intact
- The next important upside test is the all-time-high resistance around $38
- A clean break above $38 would strengthen the case that the next leg of Wave 3 is underway
- Until then, I am treating the current move as consolidation inside a constructive trend rather than as a reversal
Buy / Accumulation zone
- The current accumulation area remains around the rising support structure shown on the chart
- Near term, I want to see price continue holding approximately $27-$29
- My average entry is approximately $18.53
- I am not interested in chasing emotional breakouts after a large move
- I prefer using technically constructive consolidations inside strong trends
- ZETA continues to fit that framework for me
Targets
- Near-term support: approximately $27-$29
- Next key resistance: approximately $38
- Higher-degree Wave 3 target: approximately $70
- If that target is reached, I would expect to trim part of the position
- A future pullback into approximately the $45-$50 area would then become interesting for potential recycling
- Ultimate long-term target: approximately $105
Portfolio note
ZETA is one of the clearest examples of why I like combining long-term technical structure with fundamental conviction.
The breakout in June, the successful retest, and the strong post-earnings reaction all confirmed that the market was beginning to recognize the setup again.
Since then, the chart has behaved in a constructive way.
My approach here is straightforward. I want to see the current consolidation hold above the $27-$29 area, then I want to see whether ZETA can make its way back to the $38 all-time-high resistance.
If that level breaks, I believe the larger Wave 3 structure can continue developing toward the $70 area.
That remains my main target for this phase of the cycle, while $105 stays the longer-term objective if the broader structure continues to play out.  Long
Long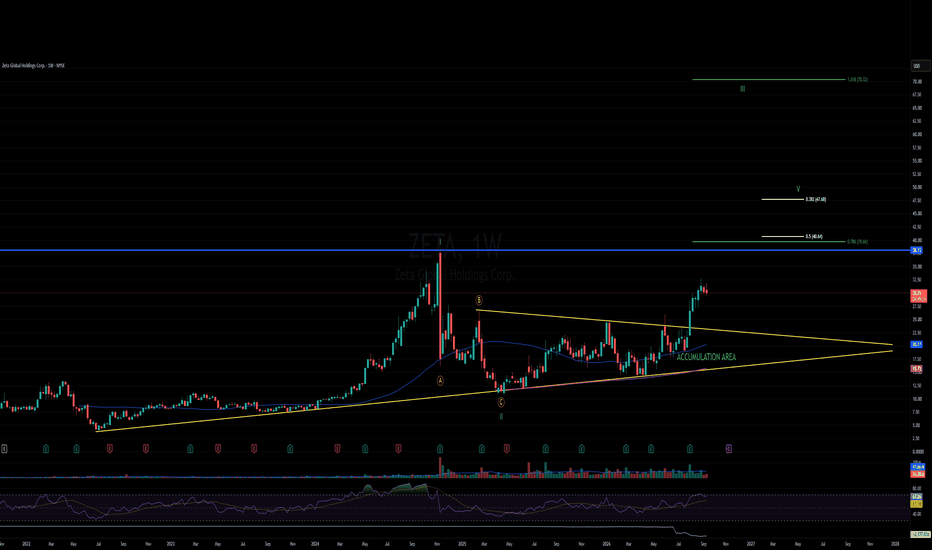
MESZ Sep 18: Can 7680 Hold for a Bounce Toward 7738?MESZ is trading around 7,700 after a sharp short-term sell-off.
The first downside liquidity and reaction level I’m watching is around 7,680. Price could test that area before deciding on the next directional move.
If buyers defend 7,680, the first upside liquidity target sits around 7,738.
The more important downside level is 7,656. A confirmed 1-hour or 4-hour close below that area would invalidate my short-term bullish setup and shift the structure bearish.
Key levels
7,680 — first pullback / reaction level
7,738 — upside liquidity target
7,656 — bullish invalidation
Bullish scenario: Hold 7,680–7,656 → watch for continuation toward 7,738.
Bearish scenario: Lose 7,656 with confirmation → stop looking for the bullish bounce and respect further downside.
Not financial advice. No confirmation, no trade. CME_MINI:MESZ2026 Long 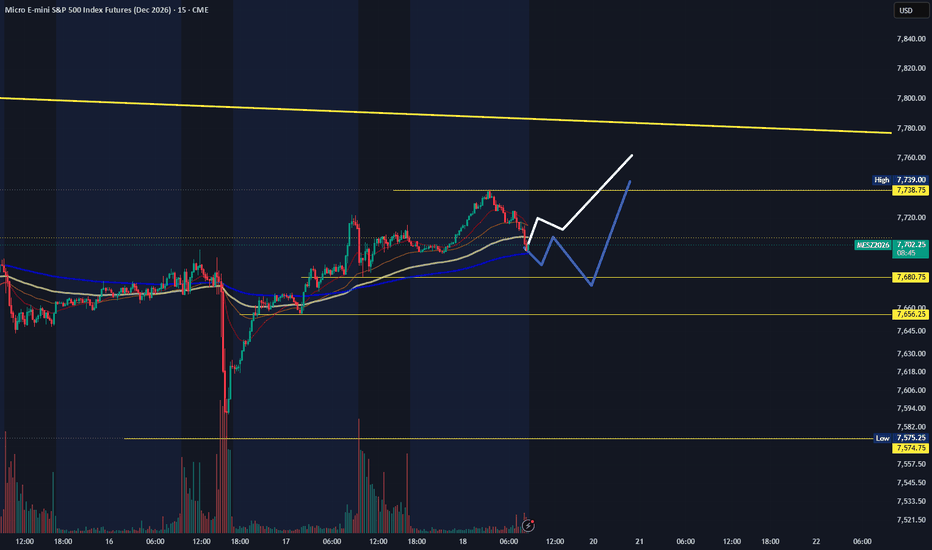
 Long
Long
 Short
Short
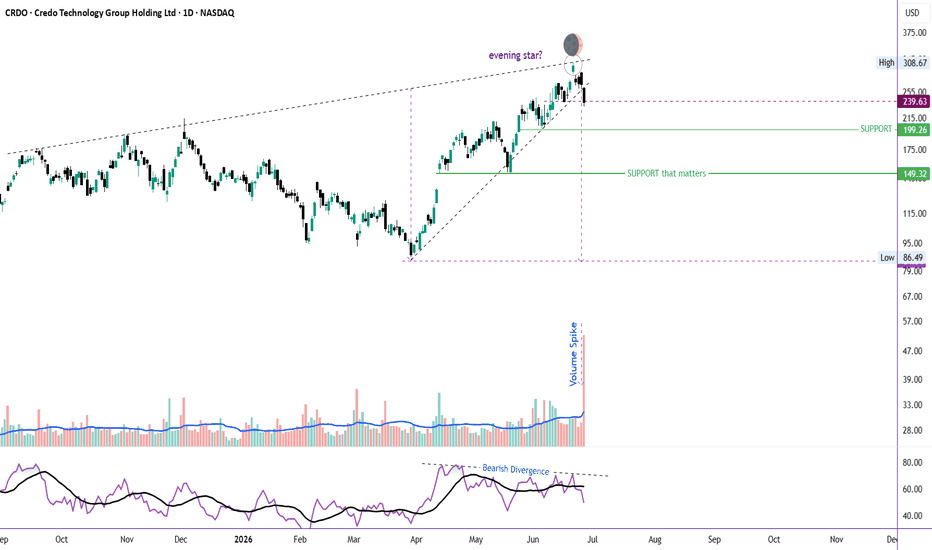
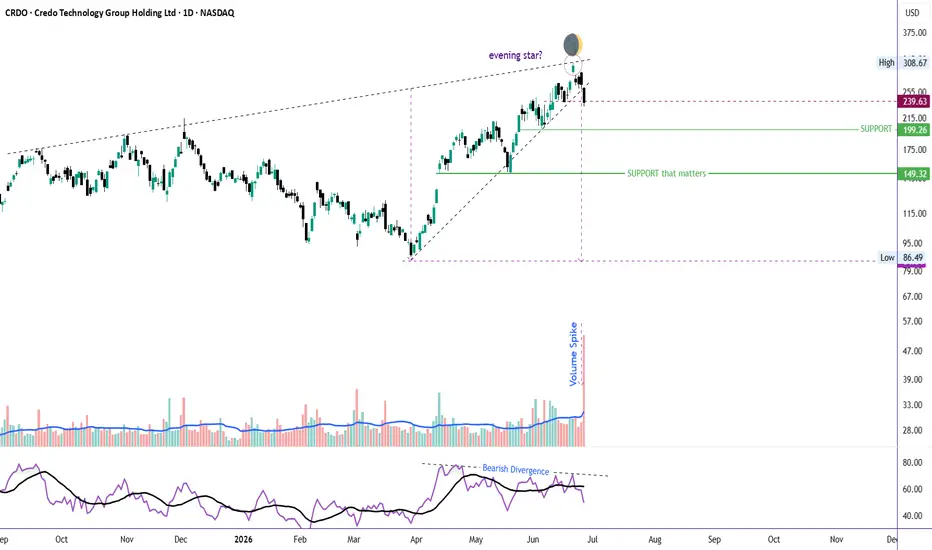
CRDO: Multi-TF Bearish Divergence Signals a Major CorrectionCRDO has hit the target shared previously (see attached post).
Now it appears to be entering a significant corrective phase after an extended bullish run.
The stock has developed bearish divergence on both the Daily and Weekly timeframes, indicating that bullish momentum has been fading despite price making new highs. It recently reached the upper boundary of a rising wedge near 308, where sellers stepped in aggressively.
Adding to the bearish case, price formed an Evening Star reversal pattern, followed by a gap-down session that confirmed the shift in momentum. The subsequent breakdown below the wedge occurred on nearly four times the average daily trading volume, suggesting strong institutional selling rather than routine profit-taking.
In the short term, CRDO could attempt a throwback to retest the breakdown area around 260. However, unless that level is reclaimed decisively, the path of least resistance remains to the downside.
Key support levels to watch are:
199 – First major support
149 – Secondary support
86–90 – Long-term measured target based on the wedge breakdown
Bearish thesis invalidation: A strong daily close above 310 would invalidate the current bearish setup and shift the outlook back in favor of the bulls.
While short-term bounces are always possible, the combination of multi-timeframe bearish divergence, a completed rising wedge breakdown, heavy distribution volume, and a confirmed reversal candlestick pattern suggests that the correction may have only just begun.  Short
Short