 Long
LongWolfe Wave
Long
WTI Crude Oil – Bullish Wolfe Wave Reversal SetupThe chart shows a potential bullish Wolfe Wave formation, with point (5) developing near the 100.5–101.0 support zone. A sustained hold around this area could trigger a reversal, with the first important confirmation coming from a break above the descending Wolfe Wave resistance line. The marked level around 101.94 is an important short-term trend-reversal zone; trading above this level could strengthen the bullish scenario toward 104–106. The setup remains invalid if price breaks decisively bel
 Long
Long
WTI Crude Oil – Triple Top / Bearish Wolfe Wave Setup - Updated.
The updated chart shows a potential triple-top formation near the 105.0–105.5 zone, with price testing the same resistance area for the third time.
The setup is valid only while price remains around the current resistance levels; a decisive move to a new higher high would invalidate the triple-top structure and the bearish Wolfe Wave scenario. If price gets rejected from this zone, the immediate focus would be on the rising support line around 101–102, followed by the Wolfe Wave projected t
Short
WOLF | The time to go long has come- Timeframe: Weekly
- Trade type: Buy stop order
- Price: 27.65
- Take Profit: Open
- Stop Loss: 23.37 (-15.50 %)
Idea: Long on a breakout above last week's high - bullish momentum continuation.
Entry: Buy stop above last week’s high.
Stop-loss: Below the low of the same candle.
If the weekly candle closes below this level, the trade is invalidated.
Take Profit: Trailing stop following the lows of new weekly candles.
 Long
Long
WTI Crude Oil – 30-Minute Wolfe Wave SetupThe chart shows a developing bearish Wolfe Wave, with price approaching point (5) around the 103.5–104.0 zone. If point (5) holds as a rejection area, the pattern suggests a potential decline toward the projected Wolfe Wave target around 98.0–98.5. The setup would gain strength if price breaks below the immediate 101.0 support with follow-through, confirming bearish momentum. A sustained move above point (5) would weaken the pattern and could invalidate the projected downside move. Overall, the
Short
TradingView Idea – WTI Crude Oil - 1 hourWTI appears to have completed a **5-wave impulsive advance**, with Wave (5) topping near **$95.5**, followed by a rejection. The current decline from Wave (5) suggests that a corrective phase may now be developing, with the rising lower trendline around **$92–92.5** acting as the first important support. A decisive break below this trendline would strengthen the bearish setup and could open the way toward **$90**, followed by the **$87–86** zone near the projected Wolfe Wave line. The structure
Short
15 mins Crude Oil – Bearish Wolfe Wave SetupThe chart shows a potential **bearish Wolfe Wave**, with **Point 5 forming around $93.2–$93.5**, close to the upper Wolfe Wave boundary. The price action at Point 5 suggests a possible exhaustion/rejection zone after the preceding upward move. If the reversal confirms, the projected path indicates a decline toward the **$86.5–$87.0 area**, where the extended Wolfe Wave line provides a potential target zone. The rising lower trendline around **$91–$92** is an important intermediate support; a dec
Short
15 mins. Gold – Bullish Wolfe Wave SetupGold appears to be developing a bullish Wolfe Wave, with Point 5 forming around 4,380–4,400** near the lower Wolfe Wave support line. The current structure suggests a potential reversal from this Point-5 area, with the projected path targeting the 4,520–4,550 zone, where multiple trendlines provide confluence. The key confirmation would be a sustained move above the nearby 4,420–4,440 resistance area, which would strengthen the bullish reversal scenario. A decisive break below the Point-5/suppor
 Long
Long
Crude Oil – Bearish Wolfe Wave Setup - 2 hour timeThe chart shows a developing **bearish Wolfe Wave**, with price appearing to complete **Point 5 around $94–95**, near the upper Wolfe structure resistance. From this area, the projected path indicates a potential reversal toward the **Wolfe Wave target near $79–80**, which also aligns with the broader descending reference line. The recent rejection from Point 5 and the move back toward the rising lower trendline are important signals; a decisive break of this support could accelerate the downsid
Short
Crude Oil – Bearish Wolfe Wave Setup - 2 hours time frameThe chart appears to be forming a **bearish Wolfe Wave**, with price completing/approaching **Point 5 near the 8,700–8,900 zone**, which is also close to the upper trendline resistance. The marked **false breakout** above the upper structure adds confluence to the bearish reversal thesis if price fails to sustain above this area. From Point 5, the projected path suggests a corrective decline through **Points 1–4**, followed by a potential **Point 5 / Wolfe Wave target around 6,800–7,000**. The d
Short
## Crude Oil – Wolfe Wave Pattern Formation**My rating: 7.5/10 — reasonably strong bearish Wolfe Wave setup, but confirmation is still pending.**
### Pattern structure
* **Point 1:** ~83.0
* **Point 2:** ~80.0
* **Point 3:** ~84.0
* **Point 4:** ~81.0
* **Point 5:** ~84.6–84.9 — currently appears to be forming/just completed
structure broadly satisfies a **bearish Wolfe Wave**, with the key **1–4 trendline acting as the resistance/convergence line**.
### Expected path
If Point 5 is confirmed, the bearish sequence could be:
**84.0–8
Short
Can Wolfspeed Power the Next Tech Revolution?Fiscal Fourth Quarter Earnings Forecast
Wolfspeed approaches its fiscal fourth quarter earnings call under intense market scrutiny. Wall Street projects a net loss of $2.45 per share on $150 million in revenue. This outcome follows a third-quarter loss of $3.26 per share on $150.2 million in revenue. Investors closely track cash burn metrics and gross margin performance across core business units. Wide bandgap semiconductor adoption accelerates rapidly across major global industries.
Silicon
Long
BLong

es1! retests 5kes1! appears poised for a larger move down, based on the smaller timeframe count .
this leads me to believe that es1! has entered a larger fourth wave. historically, these waves take an average of 2 months to play out and typically result in a 12% decrease from the high before completing.
wave 4's often retrace back into the territory of the prior degree's wave 4, and i expect this one to follow suit.
pay attention to the green trendline i've drawn on the chart,,, it serves as a solid


NIFTY 50 – Medium-Term Technical Analysis (1D Chart)## Key Levels
* **Resistance:** 24,650–24,800
* **Bullish Invalidation:** Daily close above 24,800–24,900
* **Immediate Support:** 24,100
* **Major Support:** 23,500
* **Medium-Term Target:** 22,800–22,000 (if the bearish scenario confirms)
---
## Overall Rating
| Indicator | Rating |
| ---------------------------- | :--------: |
| Wolfe Wave Structure | ⭐⭐⭐⭐☆ |
| Trendline Analysis | ⭐⭐⭐⭐⭐ |
| Swing Analysis | ⭐⭐⭐⭐☆ |
| E
 Short
Short
# GOLD (XAU/USD) – 15-Minute Technical Analysis# GOLD (XAU/USD) – 15-Minute Technical Analysis
1. Gold is trading at a **critical inflection point**, where the price has completed a five-wave bullish advance (magenta structure) and is now testing the upper boundary of the rising trendline.
2. The rally has stalled near **4085–4090**, which acts as a strong resistance zone. This area coincides with the upper trendline and the completion of the impulsive bullish leg.
3. Price is now showing signs of rejection from this resistance, suggestin
Short
# GOLD (XAU/USD) – 30-Minute Technical Analysis# GOLD (XAU/USD) – 30-Minute Technical Analysis
1. Gold appears to be completing a **Bullish Wolfe Wave** pattern, with Points **1-2-3-4-5** clearly marked on the chart. Point **5** is projected near the lower converging trendline, which is the ideal reversal area in a Wolfe Wave setup.
2. The current decline toward **Point 5 (around 4020–4030)** represents a crucial support zone. If buyers defend this level, it could become the launching point for the next impulsive rally.
3. The green desce
Long
Accenture (ACN): Falling-Angel in the selloff ...[Accenture (ACN): Falling-Angel in the selloff — Navarro200 signals a bottom formation ...
NYSE:ACN
www.tradingview.com
Hello ❤TradingView Community😍
Accenture plc (NYSE: ACN) - On the weekly-chart.
This idea highlights the major, multi-year correction following the all-time high of $417.37 (Dec 2021) and focuses on the resulting Navarro200 harmonic pattern. The chart shows a clean, symmetrical M-pattern (X-A-B-C-D) with a distinct potential reversal zone near the current low.
A further p


XRP Backs CLARITY Act: 'A Vote Against It Is Anti-ConsumerThe CLARITY Act is entering its final stage in the Senate. Ripple is making a strong case for why lawmakers should pass it. With President Donald Trump set to meet senators at the White House on Thursday to discuss the bill, the crypto industry is hoping to get it across the finish line. They hope to succeed before Congress begins its August 7 recess.
For Ripple, the bill isn’t just another piece of legislation. Instead, it’s about finally bringing clear rules to the U.S. crypto market.
Ripple
 Short
Short
ETHEREUM [$ETH] ELLIOTT WAVE CRYPTO ANALYSIS WEEKLY TFEthereum: A High-Confluence Setup at a Multi-Year Decision Point
Ethereum has reached what I believe is one of the most important technical inflection points of this cycle.
My primary Elliott Wave count suggests that the market is completing a complex multi-year corrective structure rather than beginning a new secular bear market. The current decline is approaching a major confluence zone where long-term channel support, the 0.5-0.618 Fibonacci retracement, and structural price support conver
 Long
Long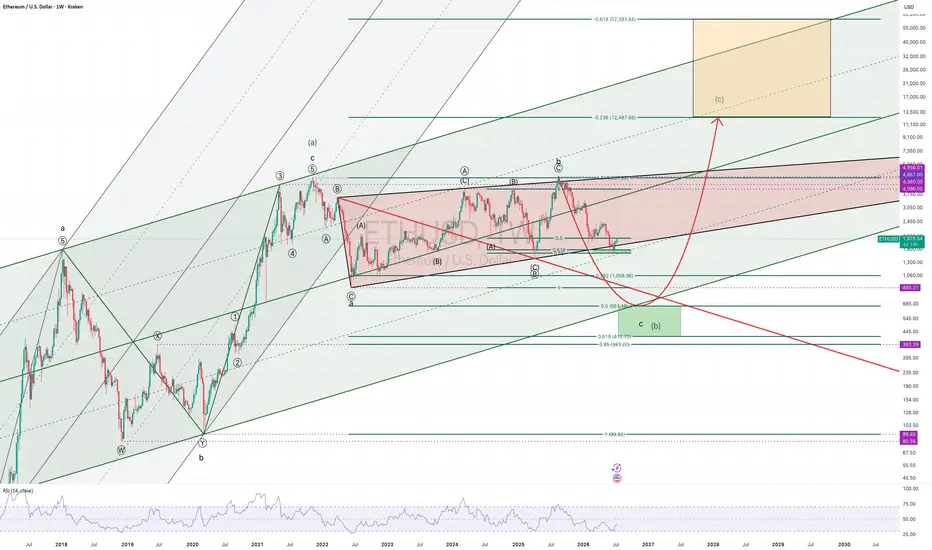
ALGO: A Wolfe-Wave Perspective#ALGO
#Algorand has been in a bearish downtrend since 2021. However, it appears that it has been forming a historical bullish Wolfe Wave, with a long-term target at the supply zone around $1.67.
Passing $0.14 provides a strong confirmation of a major trend reversal.
 Long
Long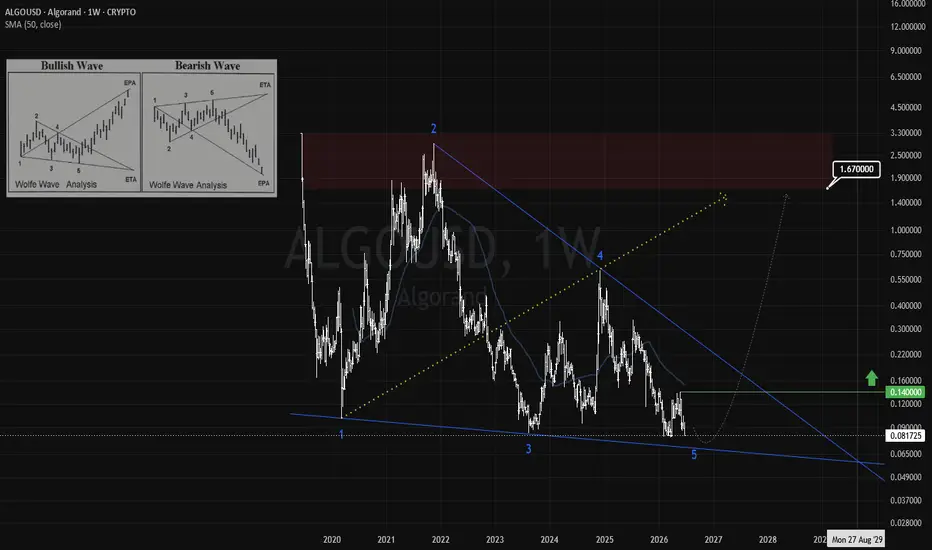
WOLF – Was at $80. Held the 50 SMA. SMH at Highs. WOLF – SMH At Highs. SOXL At Highs. This One Was $80. Now Testing $53. Catch-Up Play.
─────────────────────────────────
The semiconductor index is hitting highs and WOLF is one of the few names in the group that hasn't had its full run back. Stock was at $80 not long ago. Pulled back hard, held the 50 SMA, and is triggering a breakout at $53 right now. I'm in at $53 average with a stop at today's low.
This is a riskier name. When it moves it moves fast. That's exactly the point.
────────────────
Long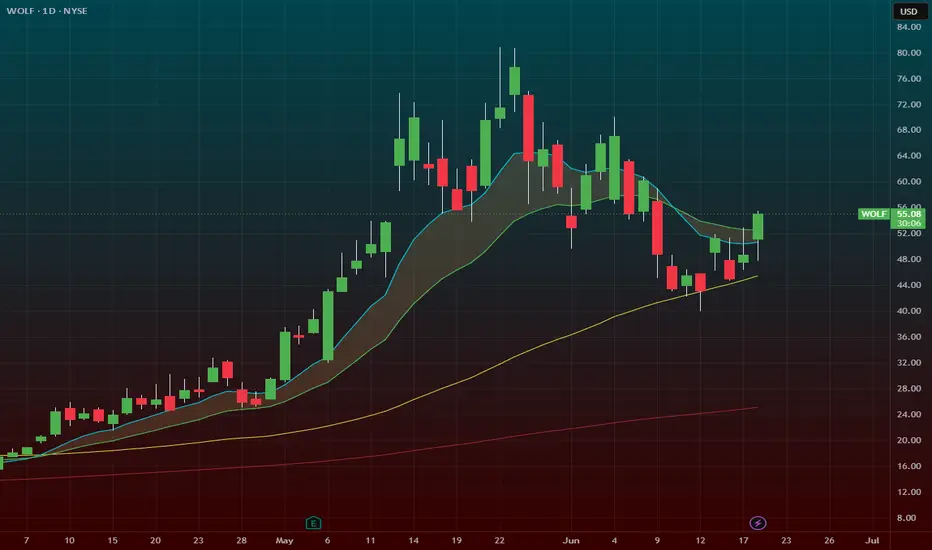
BTC Price Dive $35K Worst Case as Analyst Maps Levels for ETHBitcoin is at a pivotal moment. Analyst Gareth Soloway has identified $63,500 as the single most important level in the near term. Bitcoin rallied from its double bottom to $67,200 before pulling back to current levels. That pullback is normal and healthy. But the level being tested right now is exactly where the original breakout occurred, making it a critical support zone that bulls must defend.
If $63,500 holds, the next technical target is $70,000. If it breaks, the double bottom support we

