מעודכן
Session Tracker [GoldenDream]
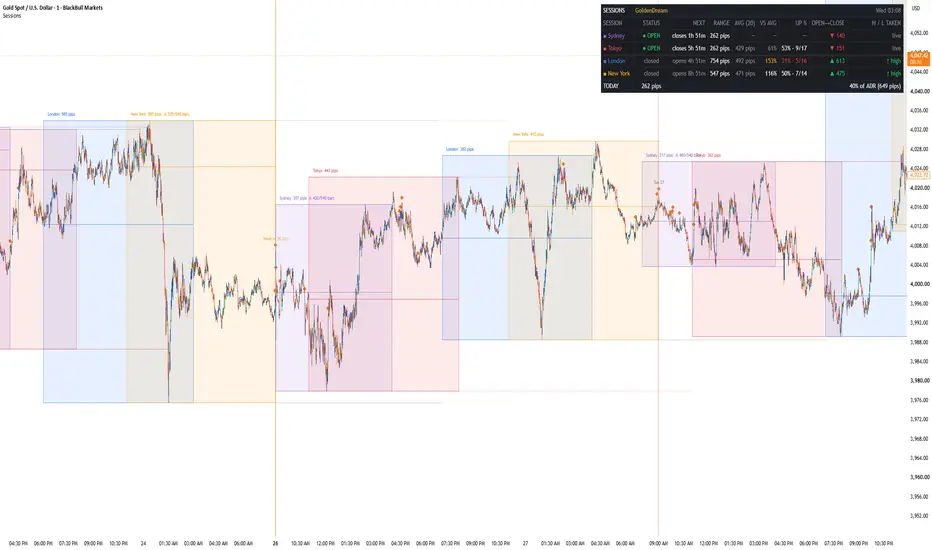
A clean, information-dense session indicator for the Sydney, Tokyo, London and New York sessions. It keeps your chart uncluttered while showing everything that matters about each session in one compact dashboard.
⭐ WHY THIS ONE IS DIFFERENT
Most session indicators define sessions in fixed UTC or exchange hours, so they drift by an hour whenever daylight saving changes. This one defines each session in its own local time zone. London is always 08:00 to 17:00 London time and New York always 08:00 to 17:00 New York time, all year round, with no manual adjustments needed.
It also goes beyond drawing boxes. It tracks how each session's range compares with its average, which way the session moved, and whether its high or low has since been taken out.
⭐ ON THE CHART
⭐ THE DASHBOARD
For each session:
Plus a summary row showing today's range as a percentage of the average daily range (ADR), and a clock in the time zone of your choice. A compact mode shows only the essentials.
⭐ ALERTS
Create one alert using "Any alert() function call" to receive:
Each alert type can be switched off. Simple per-session open alerts are also available.
⭐ HOW TO USE IT
⭐ SETTINGS
⭐ NOTES
Designed for intraday timeframes (1 hour or lower)
Default hours follow common forex conventions; adjust them to suit your market
Session data is based on your chart's symbol, so ranges and the ADR reflect that instrument
This script is open source and free to use. It's a charting tool for context and doesn't generate buy or sell signals. Nothing here is financial advice.
⭐ WHY THIS ONE IS DIFFERENT
Most session indicators define sessions in fixed UTC or exchange hours, so they drift by an hour whenever daylight saving changes. This one defines each session in its own local time zone. London is always 08:00 to 17:00 London time and New York always 08:00 to 17:00 New York time, all year round, with no manual adjustments needed.
It also goes beyond drawing boxes. It tracks how each session's range compares with its average, which way the session moved, and whether its high or low has since been taken out.
⭐ ON THE CHART
- Session boxes that track the high and low live, labelled with the session name and range
- Completed session highs and lows extended forward as reference levels until that session opens again
- Levels change style once taken out: dotted means untouched, solid means price has broken it
- Optional session open price and midpoint lines
- Optional shading when sessions overlap, such as London and New York
- Older drawings removed automatically to keep the chart clean
⭐ THE DASHBOARD
For each session:
- Status: open or closed
- Countdown to the next open or close (weekends skipped)
- Range, live while the session is open
- Average range over the last 20 sessions (adjustable)
- Range vs average, highlighted when a session is unusually active and greyed out when it's quiet
- Open-to-close direction and size
- Whether the last session's high or low has been taken out
Plus a summary row showing today's range as a percentage of the average daily range (ADR), and a clock in the time zone of your choice. A compact mode shows only the essentials.
⭐ ALERTS
Create one alert using "Any alert() function call" to receive:
- Session opens
- Session closes, with the closing range, high and low
- Breaks of a completed session's high or low
Each alert type can be switched off. Simple per-session open alerts are also available.
⭐ HOW TO USE IT
- Use the range vs average column to judge whether a session is expanding or quiet. A session already at 120% or more of its average range has done more than usual, which can matter for whether to expect further movement.
- Use the extended highs and lows as reference levels. Many traders watch whether London takes out the Asian session's range, or whether New York takes out London's high or low.
- The "H / L taken" column tells you at a glance which of the previous sessions' levels are still untouched.
⭐ SETTINGS
- Every session's name, hours, time zone and colour can be changed, and each can be switched off
- Ranges can be shown in pips or price
- Box transparency, history length, label and line options are all adjustable
⭐ NOTES
Designed for intraday timeframes (1 hour or lower)
Default hours follow common forex conventions; adjust them to suit your market
Session data is based on your chart's symbol, so ranges and the ADR reflect that instrument
This script is open source and free to use. It's a charting tool for context and doesn't generate buy or sell signals. Nothing here is financial advice.
הערות שחרור
v2 update, based on community feedbackPer-session alerts: turn alerts on or off for each session individually (Settings → Alerts). Session opens, closes and high/low breaks now only fire for the sessions you choose.
Day and week separators: dotted lines mark each trading day and solid lines mark each new week, with labels, so the chart stays readable when zoomed out. The day can start at the forex rollover (17:00 New York, default) or at midnight in your chosen time zone.
Rollover spread window: shading marks the daily rollover (16:55–17:30 New York by default), when most brokers widen spreads sharply. Optional alert when it starts. Adjust the window to match your broker.
New UP % column: the dashboard now shows how often each session has closed higher than it opened over the last N sessions (same setting as the average range). Green above 60%, red below 40%.
All existing features and settings are unchanged. Thanks to everyone who shared feedback on the first version.
הערות שחרור
v3 update, built from community feedbackCSV export: each session’s high, low, open, close, a completeness value and the bar where its high / low was taken out are now included in the Data Window and in Export chart data (chart menu → Export chart data). The timestamp on a “taken” row is the breakout time. Sessions are labelled S1–S4 in the order of your Sessions settings. Nothing extra is drawn on the chart.
UP % with count: now shows e.g. 60% · 12/20. Only completed sessions are counted; the session in progress is never included.
Incomplete-session flag: sessions with missing bars are marked ⚠ with the bar count (e.g. 96/108) and can be left out of the averages (Settings → Data Quality). Useful when comparing data feeds. Holidays and early closes will also be flagged. A session cut off because the chart’s history starts partway through it is marked ◐ instead, since that isn’t a feed problem, and it’s never counted. In the CSV export, completeness is 1 = complete, 0 = missing bars, -1 = cut off by history start.
Volatility warning: marks unusually large candles and price gaps, with an optional alert. Note: indicators can’t read live spreads on normal charts, so this is a volatility warning, not a spread measurement.
Thanks to everyone who suggested these.

GoldenDream is a boutique quantitative research brand focused on building institutional‑grade trading systems for retail traders.
tiktok.com/@goldendream54
tiktok.com/@goldendream54
כתב ויתור
המידע והפרסומים אינם מיועדים להיות, ואינם מהווים, ייעוץ או המלצה פיננסית, השקעתית, מסחרית או מכל סוג אחר המסופקת או מאושרת על ידי TradingView. קרא עוד ב־תנאי השימוש.
GoldenDream is a boutique quantitative research brand focused on building institutional‑grade trading systems for retail traders.
tiktok.com/@goldendream54
tiktok.com/@goldendream54
כתב ויתור
המידע והפרסומים אינם מיועדים להיות, ואינם מהווים, ייעוץ או המלצה פיננסית, השקעתית, מסחרית או מכל סוג אחר המסופקת או מאושרת על ידי TradingView. קרא עוד ב־תנאי השימוש.