OPEN-SOURCE SCRIPT
מעודכן HTF Gap Zones + MA Suite
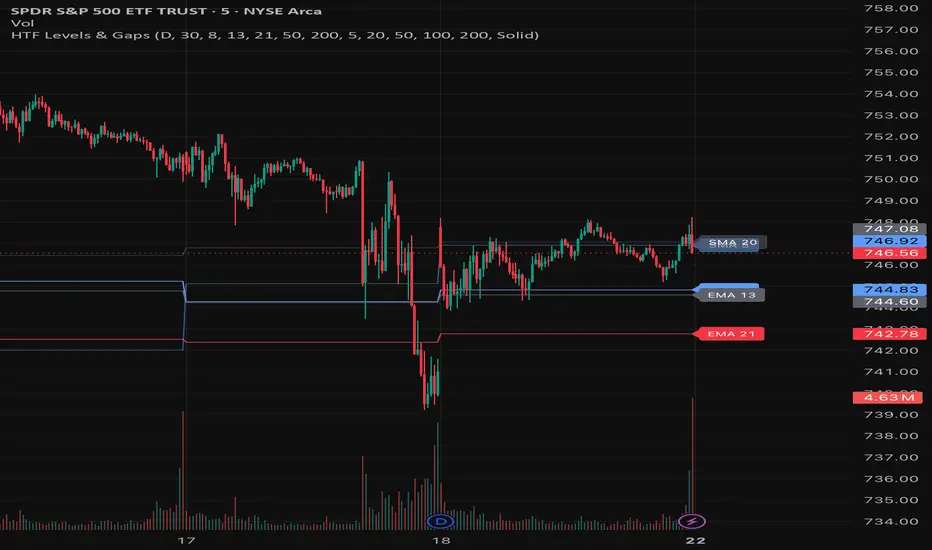
This indicator plots higher-timeframe moving averages and highlights unfilled gap zones directly on your current chart.
It uses a configurable anchor timeframe, such as Daily or Weekly, to calculate EMA and SMA levels while allowing you to view them on lower timeframes. This helps traders keep key higher-timeframe structure visible without constantly switching charts.
The script also scans recent higher-timeframe candles for bullish and bearish gaps. Only unclosed gaps are displayed, making it easier to identify potential areas of interest, imbalance, support, resistance, or price reaction zones.
Features:
Configurable higher-timeframe anchor
Detects bullish and bearish unfilled HTF gaps
Adjustable gap lookback
Custom bullish and bearish gap colors
Five customizable EMAs
Five customizable SMAs
Optional labels for moving averages
Solid, dotted, or dashed visual style
Designed to keep higher-timeframe context visible on intraday charts
This tool is useful for traders who want to combine higher-timeframe structure, gap/imbalance zones, and trend-following moving averages in one clean overlay.
It uses a configurable anchor timeframe, such as Daily or Weekly, to calculate EMA and SMA levels while allowing you to view them on lower timeframes. This helps traders keep key higher-timeframe structure visible without constantly switching charts.
The script also scans recent higher-timeframe candles for bullish and bearish gaps. Only unclosed gaps are displayed, making it easier to identify potential areas of interest, imbalance, support, resistance, or price reaction zones.
Features:
Configurable higher-timeframe anchor
Detects bullish and bearish unfilled HTF gaps
Adjustable gap lookback
Custom bullish and bearish gap colors
Five customizable EMAs
Five customizable SMAs
Optional labels for moving averages
Solid, dotted, or dashed visual style
Designed to keep higher-timeframe context visible on intraday charts
This tool is useful for traders who want to combine higher-timeframe structure, gap/imbalance zones, and trend-following moving averages in one clean overlay.
הערות שחרור
Updated the publication chart to better comply with TradingView’s chart publishing rules.The chart has been cleaned up by removing unrelated scripts and visual clutter, so the indicator’s output is easier to identify and understand.
No functional changes were made to the indicator logic in this update.
סקריפט קוד פתוח
ברוח האמיתית של TradingView, יוצר הסקריפט הזה הפך אותו לקוד פתוח, כך שסוחרים יוכלו לעיין בו ולאמת את פעולתו. כל הכבוד למחבר! אמנם ניתן להשתמש בו בחינם, אך זכור כי פרסום חוזר של הקוד כפוף ל־כללי הבית שלנו.

כתב ויתור
המידע והפרסומים אינם מיועדים להיות, ואינם מהווים, ייעוץ או המלצה פיננסית, השקעתית, מסחרית או מכל סוג אחר המסופקת או מאושרת על ידי TradingView. קרא עוד ב־תנאי השימוש.
סקריפט קוד פתוח
ברוח האמיתית של TradingView, יוצר הסקריפט הזה הפך אותו לקוד פתוח, כך שסוחרים יוכלו לעיין בו ולאמת את פעולתו. כל הכבוד למחבר! אמנם ניתן להשתמש בו בחינם, אך זכור כי פרסום חוזר של הקוד כפוף ל־כללי הבית שלנו.
כתב ויתור
המידע והפרסומים אינם מיועדים להיות, ואינם מהווים, ייעוץ או המלצה פיננסית, השקעתית, מסחרית או מכל סוג אחר המסופקת או מאושרת על ידי TradingView. קרא עוד ב־תנאי השימוש.