OPEN-SOURCE SCRIPT
RSI with Bullish/ Bearish Zones by VKK
Disclaimer: Script is not suggesting any buy or sell any stock. It's a visual identification of the direction of the current state of the stock.
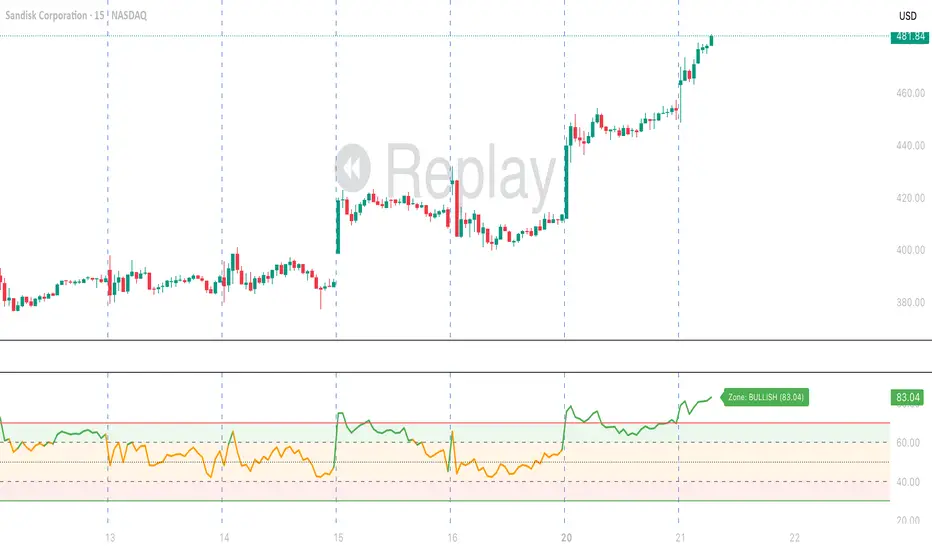
This script is a modified Relative Strength Index (RSI) designed to help traders filter out market noise by identifying three distinct momentum phases. Instead of the traditional 70/30 approach, this version uses the 40 and 60 levels to define a "Neutral/Caution" zone.
Key Features:
🟢 Bullish Zone (Above 60): Indicates strong upward momentum. The RSI line turns green, signaling a potential trend continuation.
🟠 Caution Zone (40–60): A neutral "no-man's land" where the market is often consolidating or undecided. The line turns orange, warning traders to be patient.
🔴 Bearish Zone (Below 40): Indicates strong downward momentum. The RSI line turns red, signaling a potential downtrend.
⚖️ Midline (50): A blue or your color choice dotted line acts as the ultimate pivot point between buyers and sellers.
🔥 Extremes (70/30): Classic Overbought (Red) and Oversold (Green) levels are included for mean-reversion context.
How to Use:
Trend Confirmation: Look for the RSI to sustain a position above 60 for longs or below 40 for shorts.
Filter Noise: Avoid entering aggressive trend trades when the RSI is stuck in the Orange Caution Zone.
Real-time Status: The dynamic label on the right provides an instant reading of the current market state and exact RSI value.
This script is a modified Relative Strength Index (RSI) designed to help traders filter out market noise by identifying three distinct momentum phases. Instead of the traditional 70/30 approach, this version uses the 40 and 60 levels to define a "Neutral/Caution" zone.
Key Features:
🟢 Bullish Zone (Above 60): Indicates strong upward momentum. The RSI line turns green, signaling a potential trend continuation.
🟠 Caution Zone (40–60): A neutral "no-man's land" where the market is often consolidating or undecided. The line turns orange, warning traders to be patient.
🔴 Bearish Zone (Below 40): Indicates strong downward momentum. The RSI line turns red, signaling a potential downtrend.
⚖️ Midline (50): A blue or your color choice dotted line acts as the ultimate pivot point between buyers and sellers.
🔥 Extremes (70/30): Classic Overbought (Red) and Oversold (Green) levels are included for mean-reversion context.
How to Use:
Trend Confirmation: Look for the RSI to sustain a position above 60 for longs or below 40 for shorts.
Filter Noise: Avoid entering aggressive trend trades when the RSI is stuck in the Orange Caution Zone.
Real-time Status: The dynamic label on the right provides an instant reading of the current market state and exact RSI value.
סקריפט קוד פתוח
ברוח האמיתית של TradingView, יוצר הסקריפט הזה הפך אותו לקוד פתוח, כך שסוחרים יוכלו לעיין בו ולאמת את פעולתו. כל הכבוד למחבר! אמנם ניתן להשתמש בו בחינם, אך זכור כי פרסום חוזר של הקוד כפוף ל־כללי הבית שלנו.

כתב ויתור
המידע והפרסומים אינם מיועדים להיות, ואינם מהווים, ייעוץ או המלצה פיננסית, השקעתית, מסחרית או מכל סוג אחר המסופקת או מאושרת על ידי TradingView. קרא עוד ב־תנאי השימוש.
סקריפט קוד פתוח
ברוח האמיתית של TradingView, יוצר הסקריפט הזה הפך אותו לקוד פתוח, כך שסוחרים יוכלו לעיין בו ולאמת את פעולתו. כל הכבוד למחבר! אמנם ניתן להשתמש בו בחינם, אך זכור כי פרסום חוזר של הקוד כפוף ל־כללי הבית שלנו.
כתב ויתור
המידע והפרסומים אינם מיועדים להיות, ואינם מהווים, ייעוץ או המלצה פיננסית, השקעתית, מסחרית או מכל סוג אחר המסופקת או מאושרת על ידי TradingView. קרא עוד ב־תנאי השימוש.