Doji at 50, 100, 200 EMA (v6)
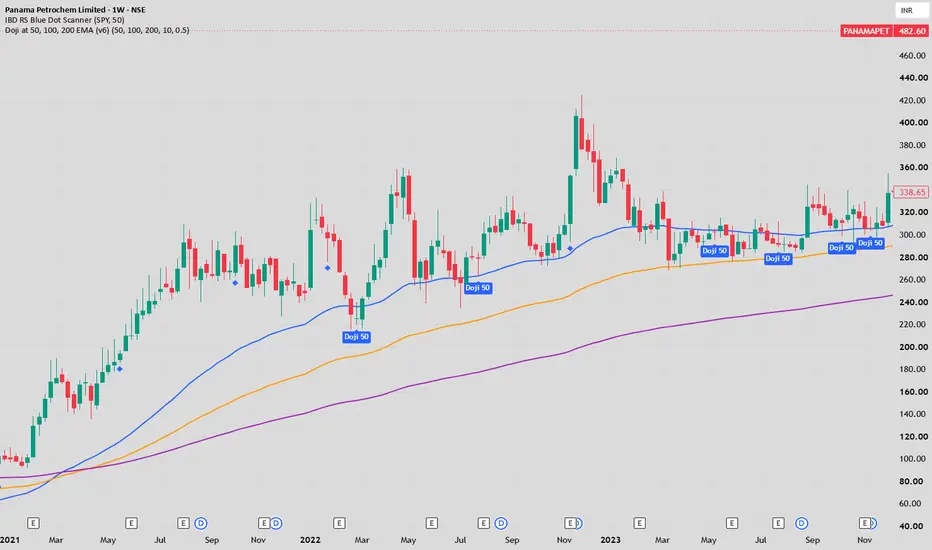
Doji at Key EMAs (50, 100, 200) — Dynamic Pullback & Reversal Signals
Overview
This indicator identifies Doji candlestick patterns forming directly at or near major dynamic support and resistance levels (50 EMA, 100 EMA, and 200 EMA).
When price tests a key Exponential Moving Average and prints an indecision candle (Doji), it often signals an exhaustion of the prevailing momentum and sets up high-probability trend continuation pullbacks or mean-reversion bounces.
Key Features
Key Dynamic Moving Averages: Plots 50, 100, and 200 EMAs directly on the chart.
Smart Doji Detection: Identifies Doji candles by evaluating the candle's body size relative to its total high-to-low range (customizable threshold).
Proximity Buffer: Checks if price action is touching or within a tight tolerance percentage of the selected EMA to avoid false misses due to slight wick differences.
Clear Visual Labels: Displays color-coded labels beneath the signal bars identifying which specific EMA the Doji is interacting with:
Blue: 50 EMA
Orange: 100 EMA
Purple: 200 EMA
Integrated Alerts: Single alert condition trigger for real-time notifications on your watchlist.
How to Use
Best Timeframes: Daily (D) and Weekly (W) charts for swing/positional setups; also functional on 1-hour/4-hour timeframes for active traders.
Trend-Following Setup (High Probability):
In an established uptrend, look for pullbacks to a rising 50 or 100 EMA marked by a Doji signal.
Trigger a long entry when the high of the Doji candle is breached on the subsequent candle.
Place the Stop Loss slightly below the Doji low or the corresponding EMA line.
Macro Reversals:
Watch for Doji prints at the 200 EMA for potential long-term trend pivots or major structural retests.
Settings & Inputs
EMA Lengths: Default 50, 100, 200 (fully adjustable).
Max Doji Body Size (%): Percentage of total range the body cannot exceed (default: 10%).
Proximity to EMA (%): Tolerance distance around the EMA line to qualify an interaction (default: 0.5%).
Disclaimer: This indicator is designed for educational and technical analysis purposes. Always combine candlestick signals with multi-timeframe analysis and proper risk management.
Overview
This indicator identifies Doji candlestick patterns forming directly at or near major dynamic support and resistance levels (50 EMA, 100 EMA, and 200 EMA).
When price tests a key Exponential Moving Average and prints an indecision candle (Doji), it often signals an exhaustion of the prevailing momentum and sets up high-probability trend continuation pullbacks or mean-reversion bounces.
Key Features
Key Dynamic Moving Averages: Plots 50, 100, and 200 EMAs directly on the chart.
Smart Doji Detection: Identifies Doji candles by evaluating the candle's body size relative to its total high-to-low range (customizable threshold).
Proximity Buffer: Checks if price action is touching or within a tight tolerance percentage of the selected EMA to avoid false misses due to slight wick differences.
Clear Visual Labels: Displays color-coded labels beneath the signal bars identifying which specific EMA the Doji is interacting with:
Blue: 50 EMA
Orange: 100 EMA
Purple: 200 EMA
Integrated Alerts: Single alert condition trigger for real-time notifications on your watchlist.
How to Use
Best Timeframes: Daily (D) and Weekly (W) charts for swing/positional setups; also functional on 1-hour/4-hour timeframes for active traders.
Trend-Following Setup (High Probability):
In an established uptrend, look for pullbacks to a rising 50 or 100 EMA marked by a Doji signal.
Trigger a long entry when the high of the Doji candle is breached on the subsequent candle.
Place the Stop Loss slightly below the Doji low or the corresponding EMA line.
Macro Reversals:
Watch for Doji prints at the 200 EMA for potential long-term trend pivots or major structural retests.
Settings & Inputs
EMA Lengths: Default 50, 100, 200 (fully adjustable).
Max Doji Body Size (%): Percentage of total range the body cannot exceed (default: 10%).
Proximity to EMA (%): Tolerance distance around the EMA line to qualify an interaction (default: 0.5%).
Disclaimer: This indicator is designed for educational and technical analysis purposes. Always combine candlestick signals with multi-timeframe analysis and proper risk management.

כתב ויתור
המידע והפרסומים אינם מיועדים להיות, ואינם מהווים, ייעוץ או המלצה פיננסית, השקעתית, מסחרית או מכל סוג אחר המסופקת או מאושרת על ידי TradingView. קרא עוד ב־תנאי השימוש.
כתב ויתור
המידע והפרסומים אינם מיועדים להיות, ואינם מהווים, ייעוץ או המלצה פיננסית, השקעתית, מסחרית או מכל סוג אחר המסופקת או מאושרת על ידי TradingView. קרא עוד ב־תנאי השימוש.