Volume Clock MA [Quanty]
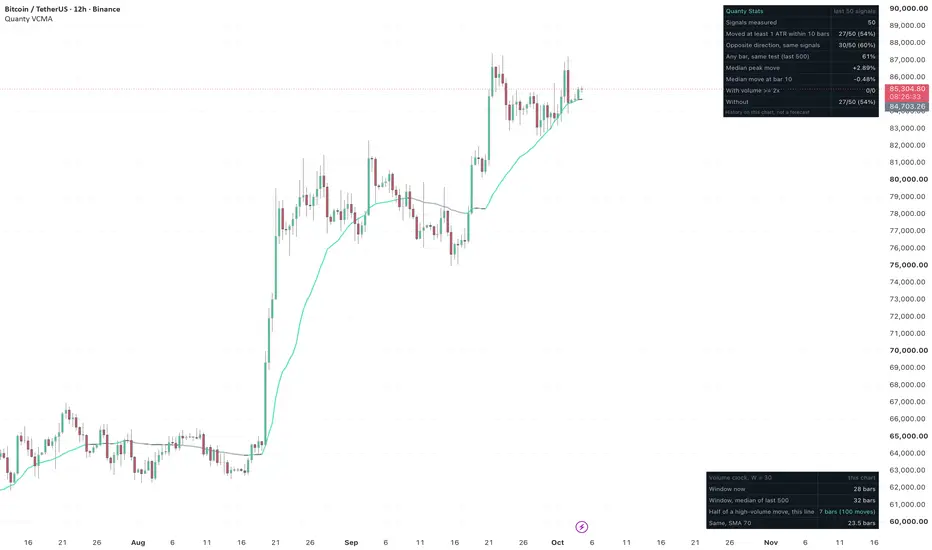
Moving averages count bars. This one counts volume.
HOW IT IS CALCULATED
Normal volume is the average volume of the previous 200 bars. The line is the volume-weighted average price of the most recent W bars' worth of that normal volume (W = 30 by default). The script walks back from the current bar and adds bars until their volume reaches 30 times normal volume; the oldest bar enters only with the part of its volume that is still needed.
When a few bars trade heavily, that much volume fits into those few bars, the window shrinks and the line catches up with price. When the market is quiet, the window reaches further back and the line barely moves. In very quiet stretches the window stops at 5 x W bars and the line becomes a plain VWMA of those bars. Only closed bars shape the line; nothing repaints.
WHAT WE MEASURED
On 135 OKX series (40 coins, 15m to 1D) we compared the line with the SMA and EMA lengths that have the same overall smoothness: a median 70-bar SMA and 62-bar EMA. After a high-volume move (volume at least 2x normal, candle body at least 1 ATR), the volume clock covered half of the move in a median 6 bars. The SMA took 29 and the EMA 22. The volume clock was ahead on all 135 series and on every timeframe.
In quiet stretches (volume under 0.7x normal) it moved less per bar than both: 0.032 ATR against 0.048 and 0.042. After low-volume moves of at least 1 ATR it was not slower: 14 bars against 22 and 20.
We repeated the test on 60 Binance perpetuals (4h) that were not in the first set: 6 bars against 28 for the SMA and 21 for the EMA, ahead on all 60.
WHAT IT IS NOT
Crossing the line is not a trading signal. On 141 OKX series, within 10 bars of the first close beyond the line, price moved at least 1 ATR in that direction in a median 59.2% of cases and at least 1 ATR the other way in 59.4%. After any bar the figure was 59.3%. That is a coin toss, and SMA 20 and VWMA 20 scored the same. The Quanty Stats table runs this test on your chart.
READING IT
The line is mint while it rises, grey while it falls and dim when its slope is under 0.01 ATR per bar.
The clock table (bottom right) shows how many bars the window spans now and its median over the last 500 bars. It also shows, on this chart, how many bars this line and a comparison SMA needed to cover half of each high-volume move. The comparison SMA (70 bars by default) can be drawn on the chart.
SETTINGS
Window (W): how many bars of normal volume to average, 30 by default. Normal volume: average of the last 200 bars. Longest window: 5 x W bars. Source, colours, the flat threshold and the comparison SMA are adjustable.
HOW TO READ THE STATS TABLE
The table in the corner measures this indicator's own past signals on the chart you are viewing: how many signals fired (the number after the slash), and in how many of them price moved at least 1 ATR (14 bars) in the signal's direction within the next 10 bars. It is a measurement of history on this symbol and timeframe, not a prediction and not a promise. Change the symbol or the timeframe and the numbers change with it. Past results do not guarantee future results.
The next row tests the same signals in the opposite direction: if both directions score about the same, the signal marked a volatile moment, not a direction. The row after that runs the same test on every bar of the chart in a random direction, so you can see what a coin toss would have scored here. Two more rows split the count by volume: signals whose candle volume was at least 2 times the average of the previous 50 bars, and the rest. When one side has only a handful of signals, read it as a handful, not as a rate. Pending signals are too recent to be measured and are not counted. The threshold can be set in ATR or in percent, and the number of bars ahead is a setting.
Here a signal is the first close beyond the line, tested in its own direction.
Not investment advice.
HOW IT IS CALCULATED
Normal volume is the average volume of the previous 200 bars. The line is the volume-weighted average price of the most recent W bars' worth of that normal volume (W = 30 by default). The script walks back from the current bar and adds bars until their volume reaches 30 times normal volume; the oldest bar enters only with the part of its volume that is still needed.
When a few bars trade heavily, that much volume fits into those few bars, the window shrinks and the line catches up with price. When the market is quiet, the window reaches further back and the line barely moves. In very quiet stretches the window stops at 5 x W bars and the line becomes a plain VWMA of those bars. Only closed bars shape the line; nothing repaints.
WHAT WE MEASURED
On 135 OKX series (40 coins, 15m to 1D) we compared the line with the SMA and EMA lengths that have the same overall smoothness: a median 70-bar SMA and 62-bar EMA. After a high-volume move (volume at least 2x normal, candle body at least 1 ATR), the volume clock covered half of the move in a median 6 bars. The SMA took 29 and the EMA 22. The volume clock was ahead on all 135 series and on every timeframe.
In quiet stretches (volume under 0.7x normal) it moved less per bar than both: 0.032 ATR against 0.048 and 0.042. After low-volume moves of at least 1 ATR it was not slower: 14 bars against 22 and 20.
We repeated the test on 60 Binance perpetuals (4h) that were not in the first set: 6 bars against 28 for the SMA and 21 for the EMA, ahead on all 60.
WHAT IT IS NOT
Crossing the line is not a trading signal. On 141 OKX series, within 10 bars of the first close beyond the line, price moved at least 1 ATR in that direction in a median 59.2% of cases and at least 1 ATR the other way in 59.4%. After any bar the figure was 59.3%. That is a coin toss, and SMA 20 and VWMA 20 scored the same. The Quanty Stats table runs this test on your chart.
READING IT
The line is mint while it rises, grey while it falls and dim when its slope is under 0.01 ATR per bar.
The clock table (bottom right) shows how many bars the window spans now and its median over the last 500 bars. It also shows, on this chart, how many bars this line and a comparison SMA needed to cover half of each high-volume move. The comparison SMA (70 bars by default) can be drawn on the chart.
SETTINGS
Window (W): how many bars of normal volume to average, 30 by default. Normal volume: average of the last 200 bars. Longest window: 5 x W bars. Source, colours, the flat threshold and the comparison SMA are adjustable.
HOW TO READ THE STATS TABLE
The table in the corner measures this indicator's own past signals on the chart you are viewing: how many signals fired (the number after the slash), and in how many of them price moved at least 1 ATR (14 bars) in the signal's direction within the next 10 bars. It is a measurement of history on this symbol and timeframe, not a prediction and not a promise. Change the symbol or the timeframe and the numbers change with it. Past results do not guarantee future results.
The next row tests the same signals in the opposite direction: if both directions score about the same, the signal marked a volatile moment, not a direction. The row after that runs the same test on every bar of the chart in a random direction, so you can see what a coin toss would have scored here. Two more rows split the count by volume: signals whose candle volume was at least 2 times the average of the previous 50 bars, and the rest. When one side has only a handful of signals, read it as a handful, not as a rate. Pending signals are too recent to be measured and are not counted. The threshold can be set in ATR or in percent, and the number of bars ahead is a setting.
Here a signal is the first close beyond the line, tested in its own direction.
Not investment advice.

כתב ויתור
המידע והפרסומים אינם מיועדים להיות, ואינם מהווים, ייעוץ או המלצה פיננסית, השקעתית, מסחרית או מכל סוג אחר המסופקת או מאושרת על ידי TradingView. קרא עוד ב־תנאי השימוש.
כתב ויתור
המידע והפרסומים אינם מיועדים להיות, ואינם מהווים, ייעוץ או המלצה פיננסית, השקעתית, מסחרית או מכל סוג אחר המסופקת או מאושרת על ידי TradingView. קרא עוד ב־תנאי השימוש.