OPEN-SOURCE SCRIPT
mohit pivot
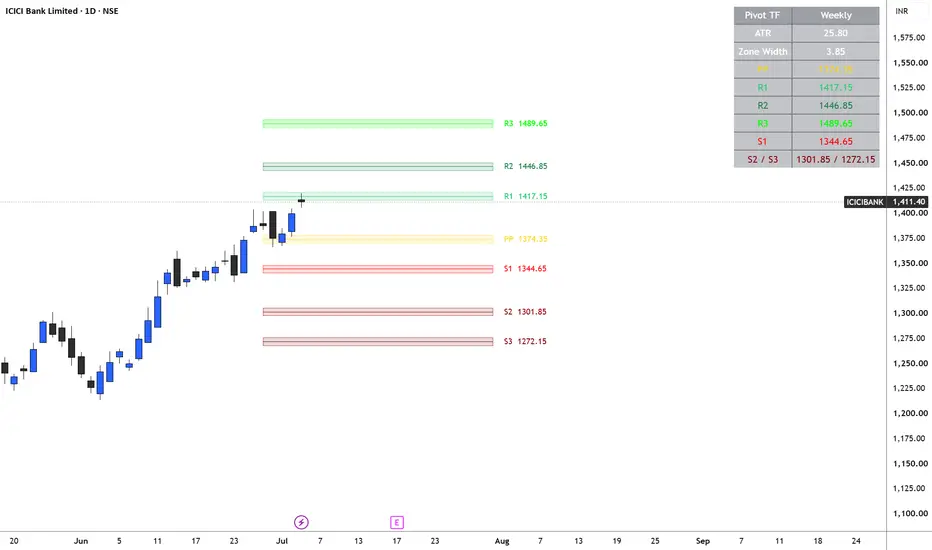
**mohit piviot — ATR Pivot Zones (Daily / Weekly / Monthly)**
This indicator plots classic Standard Pivot Points (PP, R1, R2, R3, S1, S2, S3) calculated from the previous completed Daily, Weekly, or Monthly period — selectable from the settings panel. Instead of drawing thin, single-price lines, each pivot level is expanded into a dynamic support/resistance **zone**, with the zone width driven by current ATR (Average True Range). This means the zones automatically widen in high-volatility conditions and tighten in low-volatility conditions, rather than staying a fixed distance from price regardless of how the market is behaving.
All levels are non-repainting — they're calculated only from confirmed, completed higher-timeframe candles, so the zones never shift or redraw after the fact. The script includes optional zone labels with live prices, a summary table (Pivot TF, ATR, zone width, and all seven levels), full color/style customization, and alerts for zone entries and PP crosses.
**How to read the zones:**
- **PP zone** (yellow) — the central pivot; acts as the line in the sand between bullish and bearish bias for the period.
- **R1 / R2 / R3 zones** (green shades) — potential resistance/take-profit areas above price; R3 marks the most extended resistance.
- **S1 / S2 / S3 zones** (red shades) — potential support/take-profit areas below price; S3 marks the most extended support.
---
**Suggested Entry Criteria**
*Long setups:*
- Price pulls back into an **S1 or S2 zone** and shows rejection (e.g., wick reversal, bullish candle close back above the zone) while the broader trend is up.
- Price breaks and closes **above the PP zone** with strength (momentum move from below), signaling a bias shift to bullish for the period.
- Price bounces off **S1 zone** with a bullish candle close back inside/above the zone after tagging it (mean-reversion long).
*Short setups:*
- Price rallies into an **R1 or R2 zone** and shows rejection (wick reversal, bearish candle close back below the zone) while the broader trend is down.
- Price breaks and closes **below the PP zone**, signaling a bias shift to bearish for the period.
- Price fails at **R1 zone** with a bearish candle close back inside/below the zone after tagging it (mean-reversion short).
**Suggested Exit Criteria**
- **Take-profit targets:** the next zone in sequence — e.g., a long from S1 targets PP, then R1, then R2; a short from R1 targets PP, then S1, then S2.
- **Stop-loss placement:** just beyond the outer boundary of the zone the trade was entered from (e.g., below S1's lower boundary for a long, above R1's upper boundary for a short) — since the zone is ATR-based, this stop naturally adapts to volatility.
- **Trend invalidation exit:** if trading with directional bias, exit longs on a confirmed close back below PP zone, or exit shorts on a confirmed close back above PP zone, since that signals the period's bias has flipped.
- **Zone-to-zone scalps:** for shorter-term trades, treat each zone boundary as its own scalp target rather than waiting for the full next level.
*Note: this description is a starting framework, not a complete trading system. Always combine pivot zone signals with broader market context, trend confirmation, and proper risk management before entering trades.*
This indicator plots classic Standard Pivot Points (PP, R1, R2, R3, S1, S2, S3) calculated from the previous completed Daily, Weekly, or Monthly period — selectable from the settings panel. Instead of drawing thin, single-price lines, each pivot level is expanded into a dynamic support/resistance **zone**, with the zone width driven by current ATR (Average True Range). This means the zones automatically widen in high-volatility conditions and tighten in low-volatility conditions, rather than staying a fixed distance from price regardless of how the market is behaving.
All levels are non-repainting — they're calculated only from confirmed, completed higher-timeframe candles, so the zones never shift or redraw after the fact. The script includes optional zone labels with live prices, a summary table (Pivot TF, ATR, zone width, and all seven levels), full color/style customization, and alerts for zone entries and PP crosses.
**How to read the zones:**
- **PP zone** (yellow) — the central pivot; acts as the line in the sand between bullish and bearish bias for the period.
- **R1 / R2 / R3 zones** (green shades) — potential resistance/take-profit areas above price; R3 marks the most extended resistance.
- **S1 / S2 / S3 zones** (red shades) — potential support/take-profit areas below price; S3 marks the most extended support.
---
**Suggested Entry Criteria**
*Long setups:*
- Price pulls back into an **S1 or S2 zone** and shows rejection (e.g., wick reversal, bullish candle close back above the zone) while the broader trend is up.
- Price breaks and closes **above the PP zone** with strength (momentum move from below), signaling a bias shift to bullish for the period.
- Price bounces off **S1 zone** with a bullish candle close back inside/above the zone after tagging it (mean-reversion long).
*Short setups:*
- Price rallies into an **R1 or R2 zone** and shows rejection (wick reversal, bearish candle close back below the zone) while the broader trend is down.
- Price breaks and closes **below the PP zone**, signaling a bias shift to bearish for the period.
- Price fails at **R1 zone** with a bearish candle close back inside/below the zone after tagging it (mean-reversion short).
**Suggested Exit Criteria**
- **Take-profit targets:** the next zone in sequence — e.g., a long from S1 targets PP, then R1, then R2; a short from R1 targets PP, then S1, then S2.
- **Stop-loss placement:** just beyond the outer boundary of the zone the trade was entered from (e.g., below S1's lower boundary for a long, above R1's upper boundary for a short) — since the zone is ATR-based, this stop naturally adapts to volatility.
- **Trend invalidation exit:** if trading with directional bias, exit longs on a confirmed close back below PP zone, or exit shorts on a confirmed close back above PP zone, since that signals the period's bias has flipped.
- **Zone-to-zone scalps:** for shorter-term trades, treat each zone boundary as its own scalp target rather than waiting for the full next level.
*Note: this description is a starting framework, not a complete trading system. Always combine pivot zone signals with broader market context, trend confirmation, and proper risk management before entering trades.*
סקריפט קוד פתוח
ברוח האמיתית של TradingView, יוצר הסקריפט הזה הפך אותו לקוד פתוח, כך שסוחרים יוכלו לעיין בו ולאמת את פעולתו. כל הכבוד למחבר! אמנם ניתן להשתמש בו בחינם, אך זכור כי פרסום חוזר של הקוד כפוף ל־כללי הבית שלנו.

כתב ויתור
המידע והפרסומים אינם מיועדים להיות, ואינם מהווים, ייעוץ או המלצה פיננסית, השקעתית, מסחרית או מכל סוג אחר המסופקת או מאושרת על ידי TradingView. קרא עוד ב־תנאי השימוש.
סקריפט קוד פתוח
ברוח האמיתית של TradingView, יוצר הסקריפט הזה הפך אותו לקוד פתוח, כך שסוחרים יוכלו לעיין בו ולאמת את פעולתו. כל הכבוד למחבר! אמנם ניתן להשתמש בו בחינם, אך זכור כי פרסום חוזר של הקוד כפוף ל־כללי הבית שלנו.
כתב ויתור
המידע והפרסומים אינם מיועדים להיות, ואינם מהווים, ייעוץ או המלצה פיננסית, השקעתית, מסחרית או מכל סוג אחר המסופקת או מאושרת על ידי TradingView. קרא עוד ב־תנאי השימוש.