מעודכן
Former Horizon | High & Low Levels
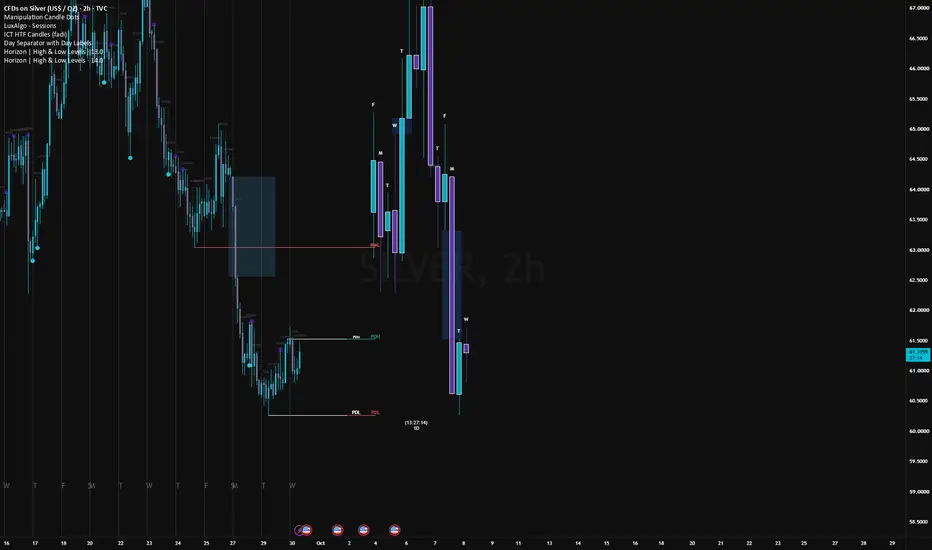
Track key price levels with customisable horizontal lines anchored to the candle wicks that created them.
Displays previous day high and low (PDH / PDL), previous week high and low (PWH / PWL), previous month high and low (PMH / PML), plus optional developing current-day highs and lows.
Four additional high/low pairs support selectable timeframes or manually entered prices, with editable labels.
Customise each line independently:
- Colour, width and solid, dashed or dotted style
- Length in bars
- Label text, colour and font size
- Individual visibility
Choose to extend lines beyond the latest candle or use a fixed length from the originating wick. Optional price values can appear beside each label. When multiple candles share the same extreme, the first matching wick is used.
Previous-period levels use completed candles and follow the symbol’s exchange/session calendar. Automatic levels require a source timeframe equal to or higher than the chart timeframe, with sufficient chart history to locate the originating wick. Manual-price markers start at the latest candle.
Designed for standard time-based candlestick charts.
Displays previous day high and low (PDH / PDL), previous week high and low (PWH / PWL), previous month high and low (PMH / PML), plus optional developing current-day highs and lows.
Four additional high/low pairs support selectable timeframes or manually entered prices, with editable labels.
Customise each line independently:
- Colour, width and solid, dashed or dotted style
- Length in bars
- Label text, colour and font size
- Individual visibility
Choose to extend lines beyond the latest candle or use a fixed length from the originating wick. Optional price values can appear beside each label. When multiple candles share the same extreme, the first matching wick is used.
Previous-period levels use completed candles and follow the symbol’s exchange/session calendar. Automatic levels require a source timeframe equal to or higher than the chart timeframe, with sufficient chart history to locate the originating wick. Manual-price markers start at the latest candle.
Designed for standard time-based candlestick charts.
הערות שחרור
Few issues with AU and AX. Hopefully this has fixed it.
כתב ויתור
המידע והפרסומים אינם מיועדים להיות, ואינם מהווים, ייעוץ או המלצה פיננסית, השקעתית, מסחרית או מכל סוג אחר המסופקת או מאושרת על ידי TradingView. קרא עוד ב־תנאי השימוש.
כתב ויתור
המידע והפרסומים אינם מיועדים להיות, ואינם מהווים, ייעוץ או המלצה פיננסית, השקעתית, מסחרית או מכל סוג אחר המסופקת או מאושרת על ידי TradingView. קרא עוד ב־תנאי השימוש.