מעודכן
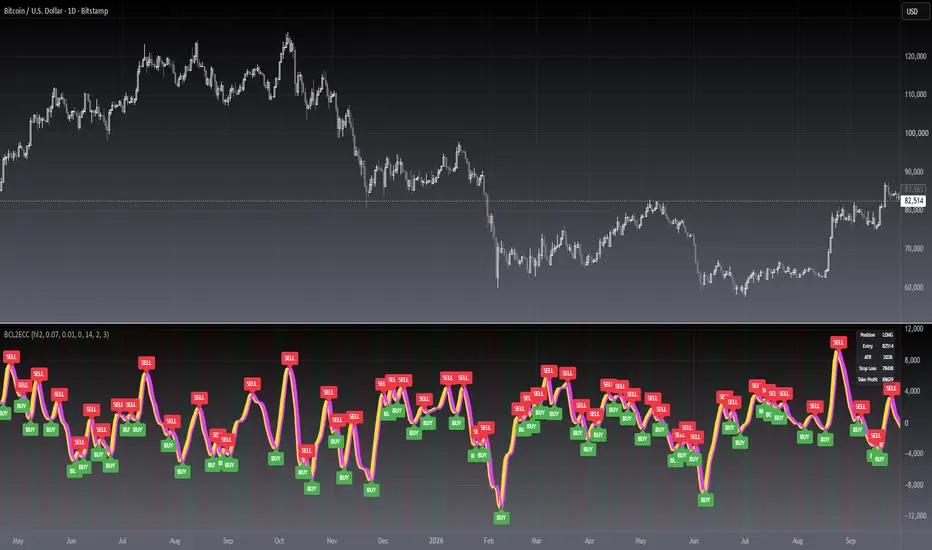
[blackcat] L2 Ehlers Cyber Cycle
Level: 2
Background
John F. Ehlers introuced Cyber Cycle Indicator in his "Cybernetic Analysis for Stocks and Futures" chapter 4 on 2004.
Function
Trading the Cyber Cycle Indicator is straightforward. Buy when the at this point. Sell when the Cycle line crosses under the Trigger line. You are at the bottom of the cycle at this point. Sell when the Cycle line crosses under the Trigger line. You are at the top of the cycle in this case. To be sure, there are crossings at other than the cyclic turning points. Many of these can be eliminated by discretionary traders using their experience or others of their favorite tools. One of the more interesting aspects of the Cyber Cycle is that it was developed simultaneously with the Instantaneous Trendline. They are opposite sides of the same coin because the total frequency content of the market being analyzed is in one indicator or the other. This is important because the conventional methods of using moving averages and oscillators can be dispensed with.
Key Signal
Cycle ---> Cyber Cycle fast line
Cycle (2) ---> Cyber Cycle slow line
Pros and Cons
100% John F. Ehlers definition translation of original work, even variable names are the same. This help readers who would like to use pine to read his book. If you had read his works, then you will be quite familiar with my code style.
Remarks
The 24th script for Blackcat1402 John F. Ehlers Week publication.
Readme
In real life, I am a prolific inventor. I have successfully applied for more than 60 international and regional patents in the past 12 years. But in the past two years or so, I have tried to transfer my creativity to the development of trading strategies. Tradingview is the ideal platform for me. I am selecting and contributing some of the hundreds of scripts to publish in Tradingview community. Welcome everyone to interact with me to discuss these interesting pine scripts.
The scripts posted are categorized into 5 levels according to my efforts or manhours put into these works.
Level 1 : interesting script snippets or distinctive improvement from classic indicators or strategy. Level 1 scripts can usually appear in more complex indicators as a function module or element.
Level 2 : composite indicator/strategy. By selecting or combining several independent or dependent functions or sub indicators in proper way, the composite script exhibits a resonance phenomenon which can filter out noise or fake trading signal to enhance trading confidence level.
Level 3 : comprehensive indicator/strategy. They are simple trading systems based on my strategies. They are commonly containing several or all of entry signal, close signal, stop loss, take profit, re-entry, risk management, and position sizing techniques. Even some interesting fundamental and mass psychological aspects are incorporated.
Level 4 : script snippets or functions that do not disclose source code. Interesting element that can reveal market laws and work as raw material for indicators and strategies. If you find Level 1~2 scripts are helpful, Level 4 is a private version that took me far more efforts to develop.
Level 5 : indicator/strategy that do not disclose source code. private version of Level 3 script with my accumulated script processing skills or a large number of custom functions. I had a private function library built in past two years. Level 5 scripts use many of them to achieve private trading strategy.
Background
John F. Ehlers introuced Cyber Cycle Indicator in his "Cybernetic Analysis for Stocks and Futures" chapter 4 on 2004.
Function
Trading the Cyber Cycle Indicator is straightforward. Buy when the at this point. Sell when the Cycle line crosses under the Trigger line. You are at the bottom of the cycle at this point. Sell when the Cycle line crosses under the Trigger line. You are at the top of the cycle in this case. To be sure, there are crossings at other than the cyclic turning points. Many of these can be eliminated by discretionary traders using their experience or others of their favorite tools. One of the more interesting aspects of the Cyber Cycle is that it was developed simultaneously with the Instantaneous Trendline. They are opposite sides of the same coin because the total frequency content of the market being analyzed is in one indicator or the other. This is important because the conventional methods of using moving averages and oscillators can be dispensed with.
Key Signal
Cycle ---> Cyber Cycle fast line
Cycle (2) ---> Cyber Cycle slow line
Pros and Cons
100% John F. Ehlers definition translation of original work, even variable names are the same. This help readers who would like to use pine to read his book. If you had read his works, then you will be quite familiar with my code style.
Remarks
The 24th script for Blackcat1402 John F. Ehlers Week publication.
Readme
In real life, I am a prolific inventor. I have successfully applied for more than 60 international and regional patents in the past 12 years. But in the past two years or so, I have tried to transfer my creativity to the development of trading strategies. Tradingview is the ideal platform for me. I am selecting and contributing some of the hundreds of scripts to publish in Tradingview community. Welcome everyone to interact with me to discuss these interesting pine scripts.
The scripts posted are categorized into 5 levels according to my efforts or manhours put into these works.
Level 1 : interesting script snippets or distinctive improvement from classic indicators or strategy. Level 1 scripts can usually appear in more complex indicators as a function module or element.
Level 2 : composite indicator/strategy. By selecting or combining several independent or dependent functions or sub indicators in proper way, the composite script exhibits a resonance phenomenon which can filter out noise or fake trading signal to enhance trading confidence level.
Level 3 : comprehensive indicator/strategy. They are simple trading systems based on my strategies. They are commonly containing several or all of entry signal, close signal, stop loss, take profit, re-entry, risk management, and position sizing techniques. Even some interesting fundamental and mass psychological aspects are incorporated.
Level 4 : script snippets or functions that do not disclose source code. Interesting element that can reveal market laws and work as raw material for indicators and strategies. If you find Level 1~2 scripts are helpful, Level 4 is a private version that took me far more efforts to develop.
Level 5 : indicator/strategy that do not disclose source code. private version of Level 3 script with my accumulated script processing skills or a large number of custom functions. I had a private function library built in past two years. Level 5 scripts use many of them to achieve private trading strategy.
הערות שחרור
OVERVIEWA modified version of Ehlers Cyber Cycle indicator that displays market cycles using two colored plots and buy/sell signals. The indicator uses a smoothing algorithm and includes customizable parameters for source price and alpha value.
FEATURES
• Dual-colored cycle plots showing trend direction
• Automatic buy/sell signal labels
• Customizable source price selection
• Adjustable alpha parameter for sensitivity control
• No overlap with price chart
HOW TO USE
Select source price:
• HL2 (default): Average of high and low prices
• Close: Closing price
• Open: Opening price
Adjust alpha value (default: 0.07):
• Lower values increase sensitivity
• Higher values reduce sensitivity
Interpret signals:
• Yellow area: Uptrend
• Fuchsia area: Downtrend
• BUY/SELL labels: Signal crosses
LIMITATIONS
• Requires minimum 7 bars for accurate calculations
• Performance may vary in choppy markets
• Not recommended for extremely volatile conditions
NOTES
• Indicator does not repaint
• Labels update automatically on new signals
• Color transparency can be adjusted in plot settings
הערות שחרור
█ OVERVIEWThis open-source oscillator implements John F. Ehlers' Cyber Cycle, isolating price's cyclical component while filtering trend noise. Version 2 adds governed stop-and-reverse signals, ATR-adaptive risk levels, a status dashboard and full alert support.
█ CONCEPTS
The Cyber Cycle (Ehlers, "Cybernetic Analysis for Stocks and Futures", 2004) strips the trend from price with a smoothing kernel and a two-pole recursive filter, then compares the cycle to its own 2-bar lag — crossings mark momentum inflections:
• Smoothed Price: a weighted 4-bar kernel suppresses single-bar noise
• Cycle Extraction: a two-pole recursive difference equation isolates the oscillating component
█ HOW TO USE
1 — Add the indicator; it renders in its own pane below price.
2 — Tune Alpha (default 0.07): lower reacts faster, higher filters more noise.
3 — A green BUY prints when the cycle crosses above its lag; a red SELL on the cross below.
4 — Check the Data Window for Stop Loss / Take Profit references and position state.
5 — Create alerts from any of the four built-in alert conditions.
Input Parameters
• Source: price input (default hl2)
• Alpha: recursive filter smoothing coefficient (default 0.07)
• Label Offset: label distance in chart units (default 0.01)
• Cooldown Bars: minimum bars between signals, 0 off (default 0)
• ATR Length: period for volatility-based levels (default 14)
• Show TP/SL Levels: risk levels in the Data Window (default on)
• Stop Loss (xATR): stop distance in ATR multiples (default 2.0)
• Take Profit (xATR): target distance in ATR multiples (default 3.0)
• Position Background: tints background by tracked position (default on)
• Status Dashboard: panel with position, entry, ATR, TP/SL (default on)
█ FEATURES
• Stop-and-reverse governance: entries flip the tracked position; duplicate same-direction signals are suppressed
• Optional cooldown spacing against whipsaw
• ATR-based take-profit / stop-loss reference levels adapting to volatility
• State-aware background tint and live status dashboard
• Four alertcondition channels plus a bar-close alert() including price
• Label history capped via max_labels_count
█ SIGNALS
• BUY (green): the cycle crossed above its 2-bar lag — potential bullish turn
• SELL (red): the cycle crossed below its 2-bar lag — potential bearish turn
• Ribbon: yellow while the cycle leads its lag, fuchsia otherwise
• Data Window: Stop Loss, Take Profit and Position State values
• Alert channels: BUY Signal, SELL Signal, Long Exit, Short Exit
█ IMPLEMENTATION NOTES
Open source under MPL 2.0. Core math preserved: a weighted smoothing kernel feeds a two-pole recursive difference equation; early bars use a momentum proxy until enough history exists. Crossings use ta.crossover / ta.crossunder; risk levels derive from ta.atr. Signals and alerts evaluate at bar close (alert.freq_once_per_bar_close), so they do not repaint within the bar.
█ LIMITATIONS
• Whipsaws in flat, range-bound markets — prefer higher timeframes or add a trend filter
• ATR levels are discretionary references; the script places no orders
• Label Offset uses chart units and may need rescaling across price magnitudes
• Defaults are a starting point, not a prescription
█ NOTES
• Based on Ehlers' Cyber Cycle, "Cybernetic Analysis for Stocks and Futures" (2004)
• Original implementation by blackcat1402; V2 adds signal governance, risk references and alerts
• Educational use only. Past behavior is no assurance of future results.
════════════════════════════════════════════════════════════════════════
For questions or feedback, please use the comments section below.
Feel free to use and modify — attribution appreciated.

Don't miss out! The first and most important thing to do is to join my Discord chat now! Click here to start your adventure: discord.com/invite/ZTGpQJq My new github for more pine development soon: github.com/wxt-coder
כתב ויתור
המידע והפרסומים אינם מיועדים להיות, ואינם מהווים, ייעוץ או המלצה פיננסית, השקעתית, מסחרית או מכל סוג אחר המסופקת או מאושרת על ידי TradingView. קרא עוד ב־תנאי השימוש.
Don't miss out! The first and most important thing to do is to join my Discord chat now! Click here to start your adventure: discord.com/invite/ZTGpQJq My new github for more pine development soon: github.com/wxt-coder
כתב ויתור
המידע והפרסומים אינם מיועדים להיות, ואינם מהווים, ייעוץ או המלצה פיננסית, השקעתית, מסחרית או מכל סוג אחר המסופקת או מאושרת על ידי TradingView. קרא עוד ב־תנאי השימוש.