Dober Stop Noise Map
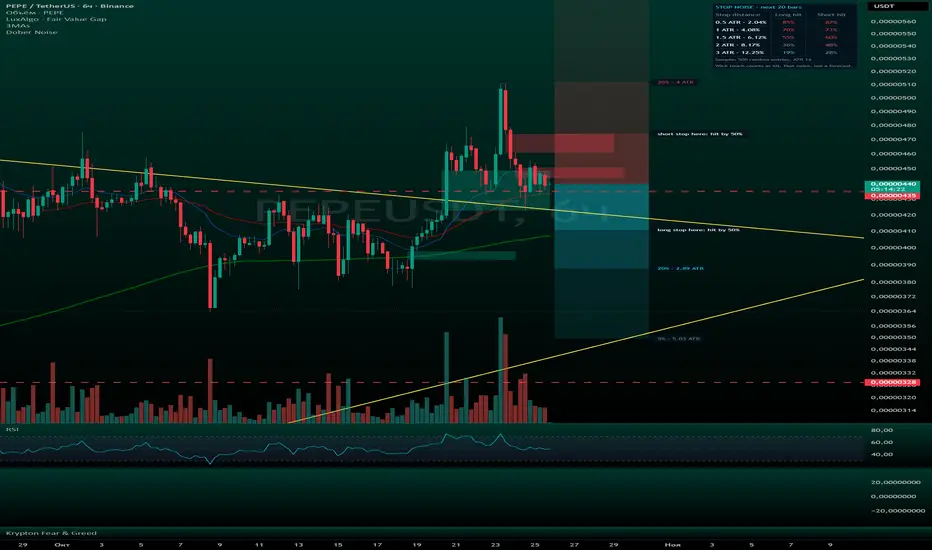
Dober Stop Noise Map shows how far price usually moves against a trade on this chart before anything meaningful happens, so you can see whether your stop sits inside ordinary noise.
OVERVIEW
Most stop tools draw a line at a fixed ATR multiple and stop there. This script asks a different question: if someone had entered on any recent bar, with no edge at all, how deep did the move against them go? That "random entry" baseline is the noise of the instrument. A stop placed inside it gets touched often, no matter how good the idea was.
HOW IT WORKS
- Every closed bar is treated as a hypothetical entry at its close, both long and short.
- For each entry the script measures the Maximum Adverse Excursion (MAE, the concept described by John Sweeney): the deepest move against the position within the next H bars (20 by default), using wicks. MAE is expressed in ATR at the moment of entry, so calm and wild periods are comparable.
- The last N completed entries (500 by default) form the distribution. Percentiles A, B and C (50, 80, 95 by default) become three zones projected to the right of the last bar: a stop at level A was touched by 50% of random entries, at level B by 20%, at level C by 5%.
- The table lists 0.5, 1, 1.5, 2 and 3 ATR stops with their distance in % and the share of random long and short entries that reached them.
- Optional: enter your own stop price and the table shows how often a stop at that distance from the last close was touched.
HOW TO USE
- Before placing a stop, compare its distance with the zones. If it sits deep inside the first zone, it is likely to be touched by normal movement on this timeframe.
- A wider stop means a smaller position for the same risk. Use the zones together with your position size, not instead of it.
- Change the horizon to match how long you usually hold a trade: a stop that survives 5 bars may not survive 50.
EXAMPLE (measured on Binance BTCUSDT 4H, 500 entries ending October 15, 2026)
A 1 ATR stop was touched by 72% of random long entries within 20 bars, a 2 ATR stop by 47%, a 3 ATR stop by 29%. These are past values for one symbol and window and will be different on your chart.
SETTINGS
Horizon, sample size, ATR length, three percentile levels, long/short/both, your stop price, zone length, historical level B lines (off by default), table position, chart language (English / Russian).
REPAINTING AND LIMITATIONS
- An entry joins the sample only after its H bars have closed, so values never change after the fact. The projected zones update with every new bar because the last close moves.
- A wick touch counts as a hit. Real fills, gaps and slippage can be worse.
- Use regular candles. Heikin Ashi, Renko and other synthetic charts change highs and lows, so the noise they show is not the market's.
- This is a description of past noise, not a forecast. It says nothing about direction or timing.
The script teaches a method and measures the past. The trade, the size and the risk are your own decisions.
RUSSIAN VERSION / НА РУССКОМ
Dober Stop Noise Map показывает, насколько далеко цена на этом графике обычно уходит против сделки, и стоит ли ваш стоп внутри обычного шума.
ЧТО ЭТО
Большинство инструментов ставят стоп на фиксированное число ATR. Здесь другой вопрос: если бы кто-то вошёл на любом недавнем баре без всякого преимущества, насколько глубоко цена уходила против него? Это базовая линия «случайного входа», то есть шум инструмента. Стоп внутри шума задевают часто, даже если идея была хорошей.
КАК РАБОТАЕТ
- Каждый закрытый бар считается входом по закрытию, в лонг и в шорт.
- Для каждого входа меряется максимальный ход против позиции (MAE, понятие Джона Суини) за следующие H баров (по умолчанию 20), по теням. MAE считается в ATR на момент входа, поэтому спокойные и бурные периоды сравнимы.
- Последние N завершённых входов (по умолчанию 500) дают распределение. Перцентили A, B и C (50, 80, 95) рисуются тремя зонами справа от последнего бара: стоп на уровне A задели 50 % случайных входов, на уровне B 20 %, на уровне C 5 %.
- В таблице стопы 0.5, 1, 1.5, 2 и 3 ATR, их расстояние в % и доля лонгов и шортов, которые до них дошли.
- По желанию впишите свою цену стопа: таблица покажет, как часто стоп на таком расстоянии от последнего закрытия задевало.
КАК ПОЛЬЗОВАТЬСЯ
- До постановки стопа сравните его расстояние с зонами. Если стоп глубоко в первой зоне, обычное движение на этом таймфрейме, скорее всего, его заденет.
- Шире стоп, меньше позиция при том же риске. Зоны работают вместе с расчётом размера, а не вместо него.
- Горизонт ставьте под своё обычное время в сделке: стоп, который переживает 5 баров, может не пережить 50.
ПРИМЕР (Binance BTCUSDT 4H, 500 входов до 15.10.2026)
Стоп 1 ATR задели 72 % случайных лонгов за 20 баров, стоп 2 ATR 47 %, стоп 3 ATR 29 %. Это прошлые значения для одного инструмента и окна, на вашем графике они будут другими.
НАСТРОЙКИ
Горизонт, размер выборки, длина ATR, три перцентиля, лонг/шорт/оба, цена вашего стопа, длина зон, исторические линии уровня B (выключены), положение таблицы, язык подписей.
ПЕРЕРИСОВКА И ОГРАНИЧЕНИЯ
- Вход попадает в выборку только после закрытия его H баров, задним числом значения не меняются. Зоны справа обновляются с каждым баром, потому что меняется последнее закрытие.
- Касание тенью считается попаданием. Реальное исполнение, гэпы и проскальзывание бывают хуже.
- Используйте обычные свечи: Heikin Ashi, Renko и другие синтетические графики меняют максимумы и минимумы, и шум получается не рыночный.
- Это описание прошлого шума, а не прогноз. О направлении и моменте индикатор ничего не говорит.
Скрипт учит методу и меряет прошлое. Сделка, размер и риск остаются вашим решением.
OVERVIEW
Most stop tools draw a line at a fixed ATR multiple and stop there. This script asks a different question: if someone had entered on any recent bar, with no edge at all, how deep did the move against them go? That "random entry" baseline is the noise of the instrument. A stop placed inside it gets touched often, no matter how good the idea was.
HOW IT WORKS
- Every closed bar is treated as a hypothetical entry at its close, both long and short.
- For each entry the script measures the Maximum Adverse Excursion (MAE, the concept described by John Sweeney): the deepest move against the position within the next H bars (20 by default), using wicks. MAE is expressed in ATR at the moment of entry, so calm and wild periods are comparable.
- The last N completed entries (500 by default) form the distribution. Percentiles A, B and C (50, 80, 95 by default) become three zones projected to the right of the last bar: a stop at level A was touched by 50% of random entries, at level B by 20%, at level C by 5%.
- The table lists 0.5, 1, 1.5, 2 and 3 ATR stops with their distance in % and the share of random long and short entries that reached them.
- Optional: enter your own stop price and the table shows how often a stop at that distance from the last close was touched.
HOW TO USE
- Before placing a stop, compare its distance with the zones. If it sits deep inside the first zone, it is likely to be touched by normal movement on this timeframe.
- A wider stop means a smaller position for the same risk. Use the zones together with your position size, not instead of it.
- Change the horizon to match how long you usually hold a trade: a stop that survives 5 bars may not survive 50.
EXAMPLE (measured on Binance BTCUSDT 4H, 500 entries ending October 15, 2026)
A 1 ATR stop was touched by 72% of random long entries within 20 bars, a 2 ATR stop by 47%, a 3 ATR stop by 29%. These are past values for one symbol and window and will be different on your chart.
SETTINGS
Horizon, sample size, ATR length, three percentile levels, long/short/both, your stop price, zone length, historical level B lines (off by default), table position, chart language (English / Russian).
REPAINTING AND LIMITATIONS
- An entry joins the sample only after its H bars have closed, so values never change after the fact. The projected zones update with every new bar because the last close moves.
- A wick touch counts as a hit. Real fills, gaps and slippage can be worse.
- Use regular candles. Heikin Ashi, Renko and other synthetic charts change highs and lows, so the noise they show is not the market's.
- This is a description of past noise, not a forecast. It says nothing about direction or timing.
The script teaches a method and measures the past. The trade, the size and the risk are your own decisions.
RUSSIAN VERSION / НА РУССКОМ
Dober Stop Noise Map показывает, насколько далеко цена на этом графике обычно уходит против сделки, и стоит ли ваш стоп внутри обычного шума.
ЧТО ЭТО
Большинство инструментов ставят стоп на фиксированное число ATR. Здесь другой вопрос: если бы кто-то вошёл на любом недавнем баре без всякого преимущества, насколько глубоко цена уходила против него? Это базовая линия «случайного входа», то есть шум инструмента. Стоп внутри шума задевают часто, даже если идея была хорошей.
КАК РАБОТАЕТ
- Каждый закрытый бар считается входом по закрытию, в лонг и в шорт.
- Для каждого входа меряется максимальный ход против позиции (MAE, понятие Джона Суини) за следующие H баров (по умолчанию 20), по теням. MAE считается в ATR на момент входа, поэтому спокойные и бурные периоды сравнимы.
- Последние N завершённых входов (по умолчанию 500) дают распределение. Перцентили A, B и C (50, 80, 95) рисуются тремя зонами справа от последнего бара: стоп на уровне A задели 50 % случайных входов, на уровне B 20 %, на уровне C 5 %.
- В таблице стопы 0.5, 1, 1.5, 2 и 3 ATR, их расстояние в % и доля лонгов и шортов, которые до них дошли.
- По желанию впишите свою цену стопа: таблица покажет, как часто стоп на таком расстоянии от последнего закрытия задевало.
КАК ПОЛЬЗОВАТЬСЯ
- До постановки стопа сравните его расстояние с зонами. Если стоп глубоко в первой зоне, обычное движение на этом таймфрейме, скорее всего, его заденет.
- Шире стоп, меньше позиция при том же риске. Зоны работают вместе с расчётом размера, а не вместо него.
- Горизонт ставьте под своё обычное время в сделке: стоп, который переживает 5 баров, может не пережить 50.
ПРИМЕР (Binance BTCUSDT 4H, 500 входов до 15.10.2026)
Стоп 1 ATR задели 72 % случайных лонгов за 20 баров, стоп 2 ATR 47 %, стоп 3 ATR 29 %. Это прошлые значения для одного инструмента и окна, на вашем графике они будут другими.
НАСТРОЙКИ
Горизонт, размер выборки, длина ATR, три перцентиля, лонг/шорт/оба, цена вашего стопа, длина зон, исторические линии уровня B (выключены), положение таблицы, язык подписей.
ПЕРЕРИСОВКА И ОГРАНИЧЕНИЯ
- Вход попадает в выборку только после закрытия его H баров, задним числом значения не меняются. Зоны справа обновляются с каждым баром, потому что меняется последнее закрытие.
- Касание тенью считается попаданием. Реальное исполнение, гэпы и проскальзывание бывают хуже.
- Используйте обычные свечи: Heikin Ashi, Renko и другие синтетические графики меняют максимумы и минимумы, и шум получается не рыночный.
- Это описание прошлого шума, а не прогноз. О направлении и моменте индикатор ничего не говорит.
Скрипт учит методу и меряет прошлое. Сделка, размер и риск остаются вашим решением.

📊 Daily crypto, stocks & gold breakdowns. Real trades, honest results.
👉 EN: t.me/+zefHRrAkge80Njcy
📩 Разборы крипты, акций и золота каждый день, простым языком.
👉 RU: t.me/+w_62Wxd2ScI5N2Zi
👉 EN: t.me/+zefHRrAkge80Njcy
📩 Разборы крипты, акций и золота каждый день, простым языком.
👉 RU: t.me/+w_62Wxd2ScI5N2Zi
כתב ויתור
המידע והפרסומים אינם מיועדים להיות, ואינם מהווים, ייעוץ או המלצה פיננסית, השקעתית, מסחרית או מכל סוג אחר המסופקת או מאושרת על ידי TradingView. קרא עוד ב־תנאי השימוש.
📊 Daily crypto, stocks & gold breakdowns. Real trades, honest results.
👉 EN: t.me/+zefHRrAkge80Njcy
📩 Разборы крипты, акций и золота каждый день, простым языком.
👉 RU: t.me/+w_62Wxd2ScI5N2Zi
👉 EN: t.me/+zefHRrAkge80Njcy
📩 Разборы крипты, акций и золота каждый день, простым языком.
👉 RU: t.me/+w_62Wxd2ScI5N2Zi
כתב ויתור
המידע והפרסומים אינם מיועדים להיות, ואינם מהווים, ייעוץ או המלצה פיננסית, השקעתית, מסחרית או מכל סוג אחר המסופקת או מאושרת על ידי TradingView. קרא עוד ב־תנאי השימוש.