Monte Carlo Probability Forecaster
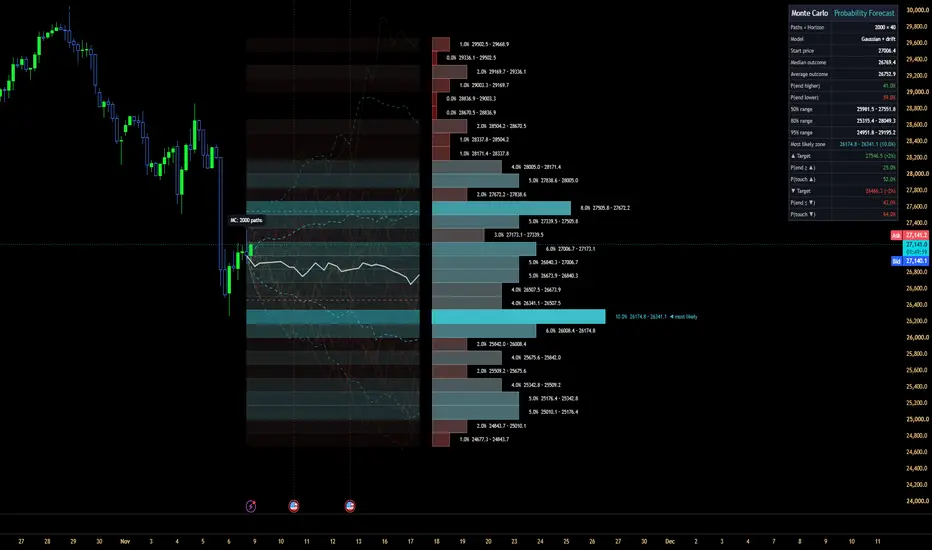
Monte Carlo Probability Forecast estimates where the price is statistically likely to be after a chosen number of bars. It simulates 2,000 possible future price paths based on the instrument's own recent behaviour, then measures how those paths cluster at the end of the forecast. Each price zone shows the percentage of simulations that finished inside it, so you can see at a glance which price areas are most and least probable — and how likely it is that your targets will be reached.
HOW IT WORKS:
1. The script measures the logarithmic returns of the most recent bars (Return Sample, default 200 bars).
2. It simulates thousands of future price paths bar by bar using one of two return models:
• Gaussian – random returns drawn from a normal distribution using the recent average return and volatility.
• Historical Resample – returns picked at random from the actual recent returns, preserving fat tails, skew, and sudden large moves.
3. At the end of the forecast horizon, the final price of every path is grouped into price zones.
4. Probability of a zone = number of paths ending in that zone ÷ total number of paths.
5. Every path is also tracked throughout the forecast to see whether it touched the upside or downside target at any point. This gives "touch" probabilities in addition to "end" probabilities.
WHAT YOU SEE ON THE CHART:
• Probability Histogram – one bar per price zone to the right of the forecast, sized by probability and labelled with its percentage and price range. The zone where most paths cluster is marked "most likely".
• Heat Zones – shaded price bands across the forecast window. Red shades show low-probability areas; cyan shades show where paths cluster most heavily.
• Percentile Cone – the 5th, 25th, 50th (median, solid line), 75th and 95th percentiles of all paths over time, showing how the range of likely outcomes widens with time.
• Sample Paths – a selection of individual simulations, green if they end above the start price and red if they end below.
• Target Lines – dashed lines for the upside target, downside target and an optional custom price level, plus a dotted line at the start price.
HOW TO USE IT:
• Set the Forecast Horizon to match your holding period. For example, 20 bars on a daily chart is roughly one trading month.
• Use the histogram and the 50% / 80% ranges to judge whether a price target is statistically realistic within that time frame.
• Compare "end" and "touch" probabilities. Price often touches a level during the period without staying beyond it at the end — useful for setting take-profit and stop-loss levels.
• Enter a specific price in Custom Level to see the probability of reaching it.
• Switch off "Keep Average Trend (Drift)" for a neutral, volatility-only view when a strong recent trend may be biasing the result.
• Use the Historical Resample model for instruments with frequent large or sudden moves.
SETTINGS:
1. Simulations:
• Random Seed – the same seed gives repeatable results; change it to draw a new random sample.
• Return Model – Gaussian or Historical Resample.
• Number of Paths – up to 2,000. Total calculation work is automatically limited to stay within TradingView's limits; if paths are reduced, the panel shows "(reduced)".
• Forecast Horizon – how many bars ahead each path is projected (5–300).
• Return Sample – how many recent bars are used to measure returns and volatility.
• Keep Average Trend (Drift) – include or remove the average trend of the sample.
• Update on Every Tick – off by default, so the forecast is built from closed candles only and stays stable until the next candle closes.
2. Probability Distribution:
• Price Zones – number of zones the final prices are grouped into (4–40).
• Histogram Width, and toggles for the histogram, heat zones, percentile cone, and displayed sample paths.
3. Targets:
• Upside Target %, Downside Target % and an optional Custom Level.
4. Style:
• Colours for low/high probability, bullish/bearish paths, median and percentile bands.
• Panel position and panel text size.
LIMITATIONS
• The simulation assumes that future returns behave like the returns in the sample window(the past). It cannot anticipate news, events, regime changes, or sudden shifts in volatility.
• It doesn't know anything about the fundamentals and valuation of an asset.
• The probabilities describe the model's range of outcomes, not a guarantee[I repeat] not a guarantee of where price will go.
• Different sample lengths, models, drift settings, and seeds will produce different probabilities.
• The forecast is calculated on the most recent bar only and is not a backtested signal.
• Don't use it as a prediction tool; it's just statistics. Simple!
DISCLAIMER
This indicator is for educational and informational purposes only and does not constitute financial advice.
Past price behaviour does not guarantee future results.
Always do your own analysis and manage your risk.
It's Open source; feel free to use. Comments are appreciated.

For any Query, DM me on Tradingview/Discord: discord.com/users/1116790754690482216
כתב ויתור
המידע והפרסומים אינם מיועדים להיות, ואינם מהווים, ייעוץ או המלצה פיננסית, השקעתית, מסחרית או מכל סוג אחר המסופקת או מאושרת על ידי TradingView. קרא עוד ב־תנאי השימוש.
For any Query, DM me on Tradingview/Discord: discord.com/users/1116790754690482216
כתב ויתור
המידע והפרסומים אינם מיועדים להיות, ואינם מהווים, ייעוץ או המלצה פיננסית, השקעתית, מסחרית או מכל סוג אחר המסופקת או מאושרת על ידי TradingView. קרא עוד ב־תנאי השימוש.