More exclusive indicators from LonesomeTheBlue
Subscribe to LonesomeTheBlue Pro Trading Suite for $49.99/month to get exclusive indicators by this author. You pay right on TradingView and can use them on your charts straight away.
Explore LonesomeTheBlue Pro Trading SuiteHello All!
First of all many Thanks to Tradingview and Pine Team for developing Pine Language all the time! Now we have a new feature and it's called Polylines and I developed RSI Radar Multi Time Frame. This script is an example and experimental work, you can use it as you wish.
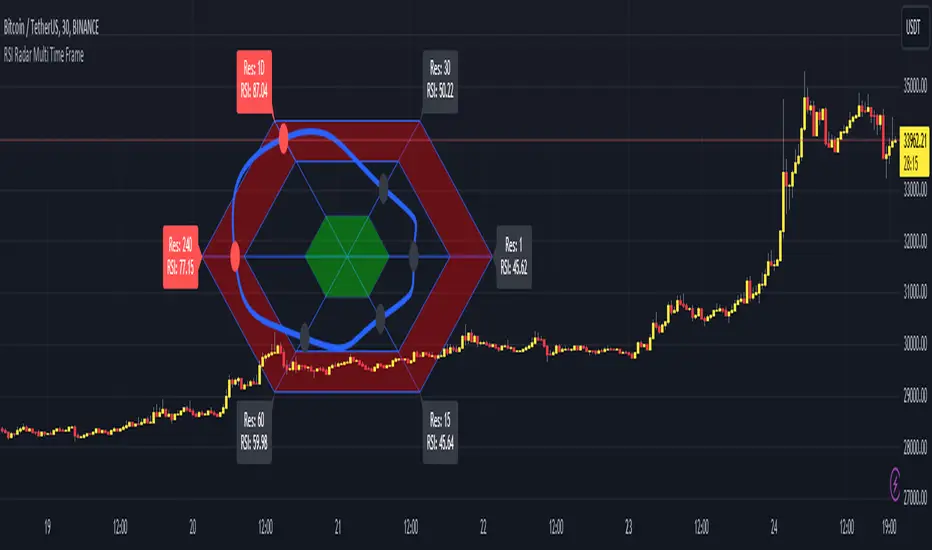
The scripts gets RSI values from 6 different time frames, it doesn't matter the time frame you choose is higher/lower or chart time frame. it means that the script can get RSI values from higher or lower time frames than chart time frame.
It's designed to show RSI Radar all the time on the chart even if you zoom in/out or scroll left/right.
You can set OB/OS or RSI line colors. Also RSI polyline is shown as Curved/Hexagon optionally.
Some screenshots here:
Doesn't matter if you zoom out, it can show RSI radar in the visible area:

Another example:

You can change the colors, or see the RSI as Hexagon:

Time frames from seconds to 1Day in this example while chart time frame is any (30mins here)

Enjoy!
First of all many Thanks to Tradingview and Pine Team for developing Pine Language all the time! Now we have a new feature and it's called Polylines and I developed RSI Radar Multi Time Frame. This script is an example and experimental work, you can use it as you wish.
The scripts gets RSI values from 6 different time frames, it doesn't matter the time frame you choose is higher/lower or chart time frame. it means that the script can get RSI values from higher or lower time frames than chart time frame.
It's designed to show RSI Radar all the time on the chart even if you zoom in/out or scroll left/right.
You can set OB/OS or RSI line colors. Also RSI polyline is shown as Curved/Hexagon optionally.
Some screenshots here:
Doesn't matter if you zoom out, it can show RSI radar in the visible area:
Another example:
You can change the colors, or see the RSI as Hexagon:
Time frames from seconds to 1Day in this example while chart time frame is any (30mins here)
Enjoy!

🎓 Free Mini Course:
lonesometheblue.com/
🤝 Telegram community:
t.me/LonesomeTheBlue_Official
💰 Subscription to Pro indicators:
Tradingview.com/spaces/LonesomeTheBlue/
lonesometheblue.com/
🤝 Telegram community:
t.me/LonesomeTheBlue_Official
💰 Subscription to Pro indicators:
Tradingview.com/spaces/LonesomeTheBlue/
כתב ויתור
המידע והפרסומים אינם מיועדים להיות, ואינם מהווים, ייעוץ או המלצה פיננסית, השקעתית, מסחרית או מכל סוג אחר המסופקת או מאושרת על ידי TradingView. קרא עוד ב־תנאי השימוש.