מעודכן
The Werkstatt [OMSF]
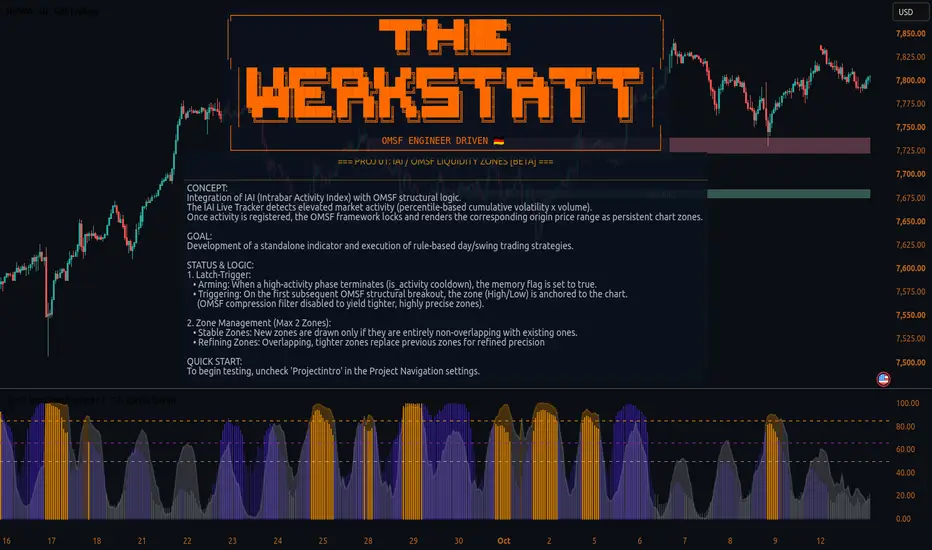
Innovation, Baseline Testing & Feedback Hub
Welcome to the WERKSTATT – a flexible open-source framework and research hub designed to introduce, test, and refine new indicator concepts, quantitative mechanics, and trading ideas.
🎯 CONCEPT & PURPOSE
To keep the main publisher profile clean and free from incomplete beta scripts, the WERKSTATT serves as a central, unified platform for experimental releases and baseline research projects.
Rather than releasing separate test scripts for every iteration, the WERKSTATT functions as an interactive container:
Interactive Project Navigation: Switch between active research projects directly within the indicator settings.
Integrated Concept & Journal Overlays: View core logic definitions, rules, and baseline test logs directly on the chart without cluttering the workspace.
💡 Feedback & Ideas: Feel free to share thoughts, suggestions, edge-case observations, and feature requests in the comments to help refine these concepts into production-ready tools.
🗂️ HOW TO USE THE WERKSTATT INTERFACE
Project Intro: Upon loading, the indicator displays the #Project Overview Overlay, explaining the current project's core logic, rules, and objectives.
Settings Navigation: Open the settings panel (🗂️ PROJECT NAVIGATION):
#Projectintro: Uncheck this toggle once familiar with the concept to hide the overlay and activate the live chart/testing tools.
#Logentry: Toggle journal entries (#log 1, #log 2, etc.) to review specific historical test setups and baseline verifications on the chart.
#Beta Visuals: Toggle compact chart dashboards and subpanel oscillators on/off.
🔬 PROJECT 01: IAI ZONES [beta]
The inaugural project introduces Cumulative Activity Zones, evolving the mechanics of the original IAI (Intrabar Activity Index) Indicator by extracting its core logic into an independent cumulative activity model and integrating it with OMSF (Objective Market Structure Framework) rules:
REFERENCES & DEPENDENCIES


⚠️ DISCLAIMER
This script is published under the THE WERKSTATT research initiative for educational, analytical, and testing purposes only ([beta]). It does not constitute financial advice. Always perform thorough replay testing and maintain strict risk management.
Welcome to the WERKSTATT – a flexible open-source framework and research hub designed to introduce, test, and refine new indicator concepts, quantitative mechanics, and trading ideas.
🎯 CONCEPT & PURPOSE
To keep the main publisher profile clean and free from incomplete beta scripts, the WERKSTATT serves as a central, unified platform for experimental releases and baseline research projects.
Rather than releasing separate test scripts for every iteration, the WERKSTATT functions as an interactive container:
Interactive Project Navigation: Switch between active research projects directly within the indicator settings.
Integrated Concept & Journal Overlays: View core logic definitions, rules, and baseline test logs directly on the chart without cluttering the workspace.
💡 Feedback & Ideas: Feel free to share thoughts, suggestions, edge-case observations, and feature requests in the comments to help refine these concepts into production-ready tools.
🗂️ HOW TO USE THE WERKSTATT INTERFACE
Project Intro: Upon loading, the indicator displays the #Project Overview Overlay, explaining the current project's core logic, rules, and objectives.
Settings Navigation: Open the settings panel (🗂️ PROJECT NAVIGATION):
#Projectintro: Uncheck this toggle once familiar with the concept to hide the overlay and activate the live chart/testing tools.
#Logentry: Toggle journal entries (#log 1, #log 2, etc.) to review specific historical test setups and baseline verifications on the chart.
#Beta Visuals: Toggle compact chart dashboards and subpanel oscillators on/off.
🔬 PROJECT 01: IAI ZONES [beta]
The inaugural project introduces Cumulative Activity Zones, evolving the mechanics of the original IAI (Intrabar Activity Index) Indicator by extracting its core logic into an independent cumulative activity model and integrating it with OMSF (Objective Market Structure Framework) rules:
- Activity Impulse: Evolved from the original IAI logic, the extracted tracker aggregates volume and volatility expansion into a cumulative activity metric (percentile-ranked over a dynamic lookback window). High-activity phases are highlighted via yellow chart dots.
--- - Latch-Trigger & Anchoring: When an activity phase terminates, a memory latch is armed. The price zone (High/Low) is anchored to the chart upon the next structural OMSF breakout.
--- - Dynamic Zone Management: Evaluates zone overlap and range hierarchy (Stable, Replace, or Refining modes) to prevent clutter while keeping high-conviction structural price levels.
REFERENCES & DEPENDENCIES
- Intrabar Activity Index (IAI)
- Objective Market Structure Framework (OMSF)
⚠️ DISCLAIMER
This script is published under the THE WERKSTATT research initiative for educational, analytical, and testing purposes only ([beta]). It does not constitute financial advice. Always perform thorough replay testing and maintain strict risk management.
הערות שחרור
Bugfix:Corrected swapped parameters for Volatility and Volume thresholds within the internal function call.
Note: Zone formation will adjust accordingly as Activity detection now accurately respects the distinct Volatility and Volume inputs.

כתב ויתור
המידע והפרסומים אינם מיועדים להיות, ואינם מהווים, ייעוץ או המלצה פיננסית, השקעתית, מסחרית או מכל סוג אחר המסופקת או מאושרת על ידי TradingView. קרא עוד ב־תנאי השימוש.
כתב ויתור
המידע והפרסומים אינם מיועדים להיות, ואינם מהווים, ייעוץ או המלצה פיננסית, השקעתית, מסחרית או מכל סוג אחר המסופקת או מאושרת על ידי TradingView. קרא עוד ב־תנאי השימוש.