Gypsy VWAP Map v0.30 1M NonPremium TV version
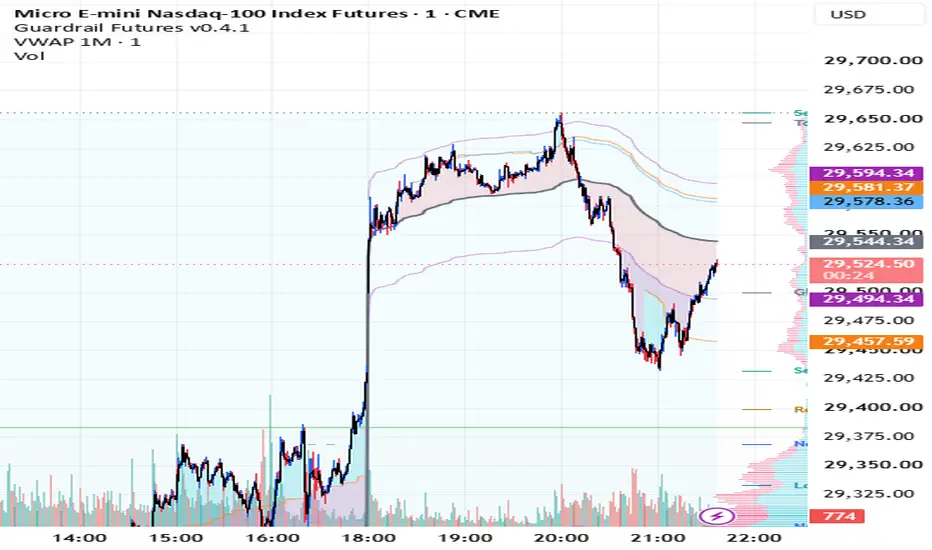
Gypsy VWAP Map is a descriptive spatial map built around session-anchored VWAP. It is designed to show how price occupies and traverses recurring VWAP-relative displacement regions—not to generate buy/sell signals or predict reactions.
VWAP can reset at the Globex, London, and New York session anchors. I personally use all three, there is also an option for just NY + Globex.
The automatic map learns four independent relationships:
• Above VWAP — Adaptive
• Above VWAP — Persistent
• Below VWAP — Adaptive
• Below VWAP — Persistent
Adaptive relationships emphasize newer evidence and can migrate more quickly when recent excursion behavior changes. Persistent relationships retain more historical evidence and adjust more slowly. Adaptive does not necessarily mean nearer, and Persistent does not necessarily mean farther; the relationships may converge, diverge, overlap, or cross.
There are manual entries for static lines away from VWAP, I change these every once in a while to match current price action (like once a day maybe) but the defaults are a good starting point. Previously the top and bottom lines were locked into the same interval, but separating them allows mapping of nonidentical relationships relative to vwap.
Compare mode combines the automatic relationships with independently configured Manual boundaries. All available boundaries are sorted by their actual distance from VWAP. The colored fields represent fixed spatial intervals between those boundaries, rather than the identity of any particular line or a directional market opinion.
You can use only manual, only auto, or compare mode. Ironically Compare was made for testing, but I ended up liking both sets of lines so I use Compare exclusively.
Candle highs and lows determine which portions of the field have physically been reached. Automatic evidence is admitted only after its selected calculation bar closes. The indicator does not project future structures or complete shapes beyond observed price action.
The 1-second build uses a one-second main calculation stream, with Adaptive defaulting to 30-second evidence and Persistent defaulting to 1-minute evidence. It requires access to TradingView second-based data.
The 1-minute build requires no second-data access. Both Adaptive and Persistent relationships use confirmed one-minute evidence, producing a slower and more conservative map.
Changing indicator inputs causes TradingView to recalculate the loaded history using the new configuration. For consistent comparison, leave the native Calculation timeframe at the build’s designated value: 1 second for the 1S version or 1 minute for the 1M version. Personally I find 1s too busy, I generally use the 5s on a 5s and 5m chart.
This indicator is intended as a neutral framework for studying VWAP-relative market behavior alongside the user’s own structure and analysis.
VWAP can reset at the Globex, London, and New York session anchors. I personally use all three, there is also an option for just NY + Globex.
The automatic map learns four independent relationships:
• Above VWAP — Adaptive
• Above VWAP — Persistent
• Below VWAP — Adaptive
• Below VWAP — Persistent
Adaptive relationships emphasize newer evidence and can migrate more quickly when recent excursion behavior changes. Persistent relationships retain more historical evidence and adjust more slowly. Adaptive does not necessarily mean nearer, and Persistent does not necessarily mean farther; the relationships may converge, diverge, overlap, or cross.
There are manual entries for static lines away from VWAP, I change these every once in a while to match current price action (like once a day maybe) but the defaults are a good starting point. Previously the top and bottom lines were locked into the same interval, but separating them allows mapping of nonidentical relationships relative to vwap.
Compare mode combines the automatic relationships with independently configured Manual boundaries. All available boundaries are sorted by their actual distance from VWAP. The colored fields represent fixed spatial intervals between those boundaries, rather than the identity of any particular line or a directional market opinion.
You can use only manual, only auto, or compare mode. Ironically Compare was made for testing, but I ended up liking both sets of lines so I use Compare exclusively.
Candle highs and lows determine which portions of the field have physically been reached. Automatic evidence is admitted only after its selected calculation bar closes. The indicator does not project future structures or complete shapes beyond observed price action.
The 1-second build uses a one-second main calculation stream, with Adaptive defaulting to 30-second evidence and Persistent defaulting to 1-minute evidence. It requires access to TradingView second-based data.
The 1-minute build requires no second-data access. Both Adaptive and Persistent relationships use confirmed one-minute evidence, producing a slower and more conservative map.
Changing indicator inputs causes TradingView to recalculate the loaded history using the new configuration. For consistent comparison, leave the native Calculation timeframe at the build’s designated value: 1 second for the 1S version or 1 minute for the 1M version. Personally I find 1s too busy, I generally use the 5s on a 5s and 5m chart.
This indicator is intended as a neutral framework for studying VWAP-relative market behavior alongside the user’s own structure and analysis.

כתב ויתור
המידע והפרסומים אינם מיועדים להיות, ואינם מהווים, ייעוץ או המלצה פיננסית, השקעתית, מסחרית או מכל סוג אחר המסופקת או מאושרת על ידי TradingView. קרא עוד ב־תנאי השימוש.
כתב ויתור
המידע והפרסומים אינם מיועדים להיות, ואינם מהווים, ייעוץ או המלצה פיננסית, השקעתית, מסחרית או מכל סוג אחר המסופקת או מאושרת על ידי TradingView. קרא עוד ב־תנאי השימוש.