OPEN-SOURCE SCRIPT
Gap Analyzer [ThetaLoop]
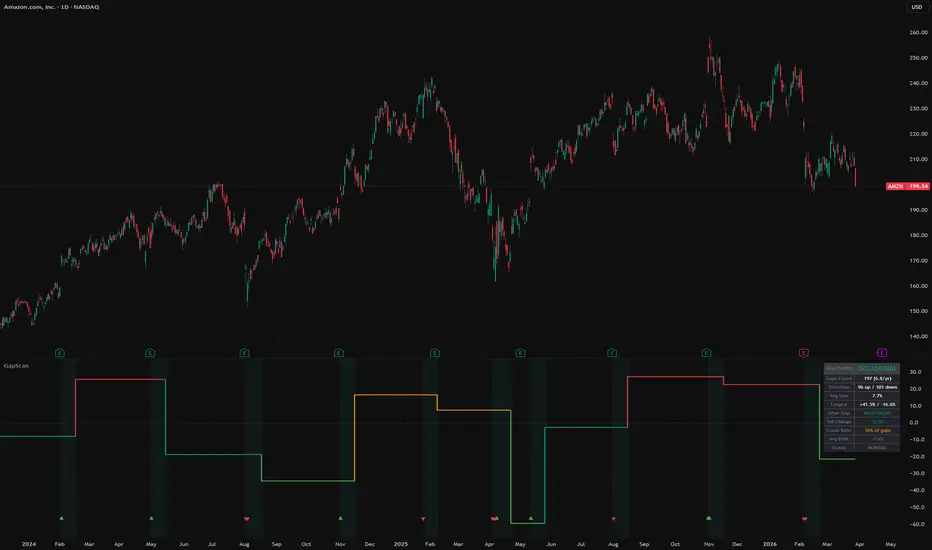
Every stock has a gap personality.
Some barely move overnight. Others routinely open 4% away from where they closed. Some gap up more than down. Others are the opposite. Some calm down quickly after a gap. Others stay volatile for weeks.
You cannot see any of this on a standard candlestick chart. This indicator builds a complete statistical profile of how your stock behaves around overnight gaps — how often, how big, which direction, and what happens to volatility afterward.
What it does
Scans the entire visible price history for significant overnight gaps (open vs. previous close). Every gap that exceeds your size threshold gets logged, classified by direction, and analyzed for post-gap volatility behavior. The result is a table showing this stock's gap DNA.
What the table shows
Gap Profile — Overall classification. FREQUENT means this stock gaps often (20+ times per year). RARE means gaps are unusual events when they happen.
Gaps Found — Total count and annualized frequency. "12 (5.2/yr)" means 12 gaps detected, roughly 5 per year.
Direction — How many gaps went up vs. down. UPSIDE BIAS means this stock gaps up more often. DOWNSIDE BIAS means more gaps are to the downside. BALANCED means roughly even.
Avg Size — Average absolute gap size across all detected events.
Largest — The biggest gap up and gap down in the visible history. This is your worst-case reference.
After Gap — What typically happens to volatility after this stock gaps. STRONG CRUSH means vol drops significantly (common for earnings-type events). VOL EXPANDS means gaps tend to trigger extended volatility (common for regime shifts or bad news).
Vol Change — The average percentage change in realized volatility from gap day to the end of the post-gap window. Negative = vol decreased. Positive = vol increased.
Crush Rate — What percentage of gaps led to a decrease in volatility afterward. Above 60% means gaps on this stock tend to be one-time events. Below 40% means gaps trigger sustained instability.
Avg Drift — After the gap, does price tend to continue in the gap direction (momentum) or reverse (mean reversion)? Positive drift after gap-downs means the stock tends to recover. Negative drift means it keeps falling.
Status — Where you are right now. JUST GAPPED, POST-GAP (with day count), or NORMAL.
The chart
Green triangles mark gap-up events. Red triangles mark gap-downs. Teal background zones show the post-gap observation window. The main plot shows either vol change, gap size, or post-gap drift as a time series (switchable).
Why this matters for options sellers
If you sell puts, gap-downs are your primary risk. Knowing that your stock gaps down on average 4.2% and does it roughly 6 times per year is directly actionable information. Compare that gap size to your buffer (strike distance from current price) — if your typical buffer is 5% and the average gap-down is 4.2%, you are cutting it close.
The post-gap vol behavior tells you whether to hold or close after a gap event. If this stock has a high crush rate (vol drops after gaps), sitting tight is statistically the better move. If vol tends to expand after gaps, getting out quickly is wiser.
The direction bias helps with strategy selection. A stock with strong upside gap bias is more suited for put selling (gaps tend to go in your favor). A stock with downside bias carries more overnight assignment risk.
Important note on gap detection
This indicator identifies gaps purely from price and volume data. It does not use an earnings calendar or news feed. A gap is a gap regardless of the cause — earnings, news, FOMC, analyst upgrades, tariff announcements, or random overnight moves. This is intentional. Your risk from a 5% gap-down is identical whether it came from earnings or a tweet. The statistical profile captures all of them.
You can toggle volume confirmation on or off. With it on, only gaps accompanied by above-average volume are counted — this filters out thin overnight moves and catches events where real participation occurred. With it off, all gaps above the size threshold are counted regardless of volume.
Settings
Min Gap Size (default 3%) — Threshold for what counts as a significant gap. Adjust based on the stock. 3% is meaningful for a $100 large-cap. For a $15 small-cap, you might want 5%.
Volume Confirmation (default on) — Require above-average volume on gap day.
Volume Multiple (default 1.5x) — How much above average volume needs to be.
Post-Gap Window (default 10) — How many days after a gap to measure vol behavior and price drift.
Display Mode — Vol Change (default), Gap Size, or Post-Gap Drift as the main time series plot.
Alerts
Gap Down Detected — Significant downside gap. Check your put exposure.
Gap Up Detected — Significant upside gap.
Post-Gap Window Complete — Analysis period after last gap is finished.
Some barely move overnight. Others routinely open 4% away from where they closed. Some gap up more than down. Others are the opposite. Some calm down quickly after a gap. Others stay volatile for weeks.
You cannot see any of this on a standard candlestick chart. This indicator builds a complete statistical profile of how your stock behaves around overnight gaps — how often, how big, which direction, and what happens to volatility afterward.
What it does
Scans the entire visible price history for significant overnight gaps (open vs. previous close). Every gap that exceeds your size threshold gets logged, classified by direction, and analyzed for post-gap volatility behavior. The result is a table showing this stock's gap DNA.
What the table shows
Gap Profile — Overall classification. FREQUENT means this stock gaps often (20+ times per year). RARE means gaps are unusual events when they happen.
Gaps Found — Total count and annualized frequency. "12 (5.2/yr)" means 12 gaps detected, roughly 5 per year.
Direction — How many gaps went up vs. down. UPSIDE BIAS means this stock gaps up more often. DOWNSIDE BIAS means more gaps are to the downside. BALANCED means roughly even.
Avg Size — Average absolute gap size across all detected events.
Largest — The biggest gap up and gap down in the visible history. This is your worst-case reference.
After Gap — What typically happens to volatility after this stock gaps. STRONG CRUSH means vol drops significantly (common for earnings-type events). VOL EXPANDS means gaps tend to trigger extended volatility (common for regime shifts or bad news).
Vol Change — The average percentage change in realized volatility from gap day to the end of the post-gap window. Negative = vol decreased. Positive = vol increased.
Crush Rate — What percentage of gaps led to a decrease in volatility afterward. Above 60% means gaps on this stock tend to be one-time events. Below 40% means gaps trigger sustained instability.
Avg Drift — After the gap, does price tend to continue in the gap direction (momentum) or reverse (mean reversion)? Positive drift after gap-downs means the stock tends to recover. Negative drift means it keeps falling.
Status — Where you are right now. JUST GAPPED, POST-GAP (with day count), or NORMAL.
The chart
Green triangles mark gap-up events. Red triangles mark gap-downs. Teal background zones show the post-gap observation window. The main plot shows either vol change, gap size, or post-gap drift as a time series (switchable).
Why this matters for options sellers
If you sell puts, gap-downs are your primary risk. Knowing that your stock gaps down on average 4.2% and does it roughly 6 times per year is directly actionable information. Compare that gap size to your buffer (strike distance from current price) — if your typical buffer is 5% and the average gap-down is 4.2%, you are cutting it close.
The post-gap vol behavior tells you whether to hold or close after a gap event. If this stock has a high crush rate (vol drops after gaps), sitting tight is statistically the better move. If vol tends to expand after gaps, getting out quickly is wiser.
The direction bias helps with strategy selection. A stock with strong upside gap bias is more suited for put selling (gaps tend to go in your favor). A stock with downside bias carries more overnight assignment risk.
Important note on gap detection
This indicator identifies gaps purely from price and volume data. It does not use an earnings calendar or news feed. A gap is a gap regardless of the cause — earnings, news, FOMC, analyst upgrades, tariff announcements, or random overnight moves. This is intentional. Your risk from a 5% gap-down is identical whether it came from earnings or a tweet. The statistical profile captures all of them.
You can toggle volume confirmation on or off. With it on, only gaps accompanied by above-average volume are counted — this filters out thin overnight moves and catches events where real participation occurred. With it off, all gaps above the size threshold are counted regardless of volume.
Settings
Min Gap Size (default 3%) — Threshold for what counts as a significant gap. Adjust based on the stock. 3% is meaningful for a $100 large-cap. For a $15 small-cap, you might want 5%.
Volume Confirmation (default on) — Require above-average volume on gap day.
Volume Multiple (default 1.5x) — How much above average volume needs to be.
Post-Gap Window (default 10) — How many days after a gap to measure vol behavior and price drift.
Display Mode — Vol Change (default), Gap Size, or Post-Gap Drift as the main time series plot.
Alerts
Gap Down Detected — Significant downside gap. Check your put exposure.
Gap Up Detected — Significant upside gap.
Post-Gap Window Complete — Analysis period after last gap is finished.
סקריפט קוד פתוח
ברוח האמיתית של TradingView, יוצר הסקריפט הזה הפך אותו לקוד פתוח, כך שסוחרים יוכלו לעיין בו ולאמת את פעולתו. כל הכבוד למחבר! אמנם ניתן להשתמש בו בחינם, אך זכור כי פרסום חוזר של הקוד כפוף ל־כללי הבית שלנו.

ThetaLoop | Algorithmic Options Research
🔍 Free CSP Score for any ticker — X-Ray Scanner:
thetaloop.app/xray
(Not financial advice)
🔍 Free CSP Score for any ticker — X-Ray Scanner:
thetaloop.app/xray
(Not financial advice)
כתב ויתור
המידע והפרסומים אינם מיועדים להיות, ואינם מהווים, ייעוץ או המלצה פיננסית, השקעתית, מסחרית או מכל סוג אחר המסופקת או מאושרת על ידי TradingView. קרא עוד ב־תנאי השימוש.
סקריפט קוד פתוח
ברוח האמיתית של TradingView, יוצר הסקריפט הזה הפך אותו לקוד פתוח, כך שסוחרים יוכלו לעיין בו ולאמת את פעולתו. כל הכבוד למחבר! אמנם ניתן להשתמש בו בחינם, אך זכור כי פרסום חוזר של הקוד כפוף ל־כללי הבית שלנו.
ThetaLoop | Algorithmic Options Research
🔍 Free CSP Score for any ticker — X-Ray Scanner:
thetaloop.app/xray
(Not financial advice)
🔍 Free CSP Score for any ticker — X-Ray Scanner:
thetaloop.app/xray
(Not financial advice)
כתב ויתור
המידע והפרסומים אינם מיועדים להיות, ואינם מהווים, ייעוץ או המלצה פיננסית, השקעתית, מסחרית או מכל סוג אחר המסופקת או מאושרת על ידי TradingView. קרא עוד ב־תנאי השימוש.