OPEN-SOURCE SCRIPT
HeikenAshi Trend Lite
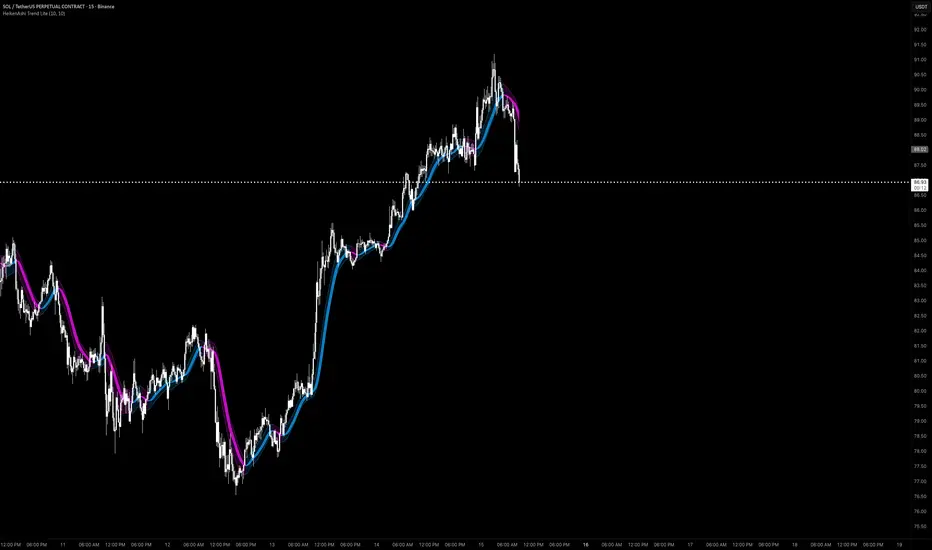
The HeikenAshi Trend Lite indicator displays double-smoothed Heikin-Ashi candles on the current timeframe as a trend overlay. By applying two passes of EMA smoothing to Heikin-Ashi calculations, it filters out market noise to reveal clean trend direction.
█ USAGE
Reading the Trend
The indicator draws a filled ribbon representing the smoothed Heikin-Ashi body. When the smoothed HA close is above the smoothed HA open, the ribbon is bullish. When below, it is bearish. The body uses a semi-transparent fill, while the wick range is drawn with a lighter shade, creating a layered visual.
Color changes represent confirmed trend shifts after double smoothing has absorbed enough price data. This filtering eliminates most false signals from choppy conditions.
█ DETAILS
The calculation follows three steps:
1 — EMA smoothing of raw OHLC values
2 — Heikin-Ashi transformation of the smoothed values
3 — Second EMA pass on the resulting HA values
This double-smoothing approach reduces noise effectively while maintaining less lag than equivalent single-pass smoothing with very long periods.
█ SETTINGS
• EMA Length: Period for the first EMA smoothing pass (default: 10).
• Smoothing Length: Period for the second EMA pass (default: 10).
• Bullish / Bearish Color: Customizable trend colors.
• Show Candles: Display traditional HA candle bodies alongside the ribbon.
This indicator uses synthetic Heikin-Ashi values that do not represent actual traded prices. It does not constitute financial advice. Past performance does not guarantee future results.
█ USAGE
Reading the Trend
The indicator draws a filled ribbon representing the smoothed Heikin-Ashi body. When the smoothed HA close is above the smoothed HA open, the ribbon is bullish. When below, it is bearish. The body uses a semi-transparent fill, while the wick range is drawn with a lighter shade, creating a layered visual.
Color changes represent confirmed trend shifts after double smoothing has absorbed enough price data. This filtering eliminates most false signals from choppy conditions.
█ DETAILS
The calculation follows three steps:
1 — EMA smoothing of raw OHLC values
2 — Heikin-Ashi transformation of the smoothed values
3 — Second EMA pass on the resulting HA values
This double-smoothing approach reduces noise effectively while maintaining less lag than equivalent single-pass smoothing with very long periods.
█ SETTINGS
• EMA Length: Period for the first EMA smoothing pass (default: 10).
• Smoothing Length: Period for the second EMA pass (default: 10).
• Bullish / Bearish Color: Customizable trend colors.
• Show Candles: Display traditional HA candle bodies alongside the ribbon.
This indicator uses synthetic Heikin-Ashi values that do not represent actual traded prices. It does not constitute financial advice. Past performance does not guarantee future results.
סקריפט קוד פתוח
ברוח האמיתית של TradingView, יוצר הסקריפט הזה הפך אותו לקוד פתוח, כך שסוחרים יוכלו לעיין בו ולאמת את פעולתו. כל הכבוד למחבר! אמנם ניתן להשתמש בו בחינם, אך זכור כי פרסום חוזר של הקוד כפוף ל־כללי הבית שלנו.

כתב ויתור
המידע והפרסומים אינם מיועדים להיות, ואינם מהווים, ייעוץ או המלצה פיננסית, השקעתית, מסחרית או מכל סוג אחר המסופקת או מאושרת על ידי TradingView. קרא עוד ב־תנאי השימוש.
סקריפט קוד פתוח
ברוח האמיתית של TradingView, יוצר הסקריפט הזה הפך אותו לקוד פתוח, כך שסוחרים יוכלו לעיין בו ולאמת את פעולתו. כל הכבוד למחבר! אמנם ניתן להשתמש בו בחינם, אך זכור כי פרסום חוזר של הקוד כפוף ל־כללי הבית שלנו.
כתב ויתור
המידע והפרסומים אינם מיועדים להיות, ואינם מהווים, ייעוץ או המלצה פיננסית, השקעתית, מסחרית או מכל סוג אחר המסופקת או מאושרת על ידי TradingView. קרא עוד ב־תנאי השימוש.