מעודכן
RLT Snapback RAYLIGHT TRADES
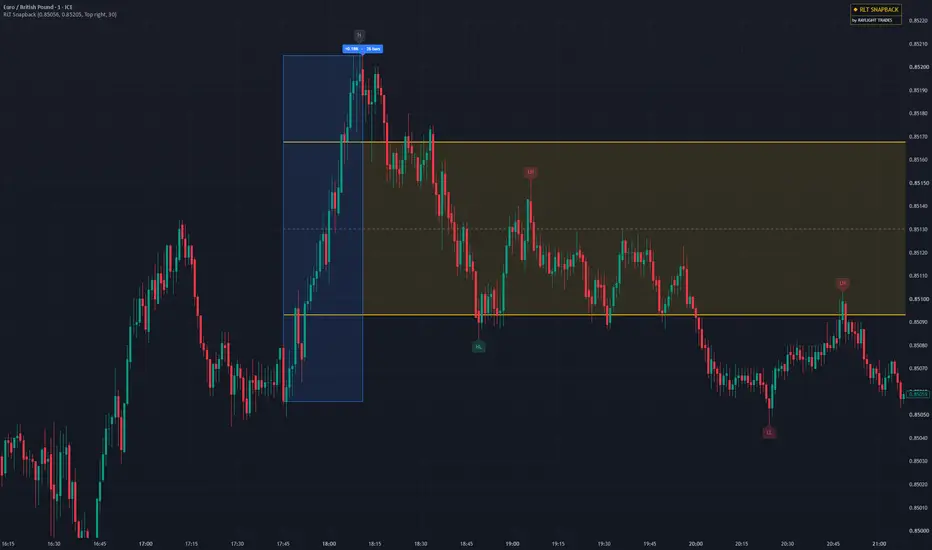
RLT Snapback is a manual pullback tool. You pick the swing, and it measures how deep the current pullback goes as a percentage of that swing. It marks the 25%–75% zone and labels the market structure from your swing onward.
It does not choose swings for you and it does not give buy or sell signals. It shows where price is relative to a swing you chose.
HOW IT WORKS
1. Point A and Point B
When you add the indicator to the chart, TradingView asks you to click two points:
Point A: the start of the swing (swing low for an up-move, swing high for a down-move)
Point B: the end of the swing (the latest swing high or low)
You can change both points at any time in the indicator settings, or by removing the indicator and adding it again.
2. Range box and levels
A box is drawn from Point A to Point B, like a date range. The pullback from Point B back toward Point A is measured, and these levels are drawn:
25% and 75%: the edges of the zone (solid lines)
50%: the midpoint (dashed, optional)
The area between 25% and 75% is shaded as the zone.
Each level has a label on the right with its price (prices are optional). A small label at Point B shows the size of the swing in % and the number of bars from A to B.
3. Live pullback status
A label next to the current price shows how deep the pullback is right now:
Grey: the pullback hasn't reached 25% yet
Gold: price is inside the 25%–75% zone
Red, INVALID: price has gone beyond 75% of the swing
INVALID uses the deepest wick since Point B, so once it appears it stays, even if price comes back into the zone. That swing is no longer valid, and you should draw a new one.
4. Market structure (HH / HL / LH / LL)
Starting from Point A only, the indicator labels the major swings as Higher High, Higher Low, Lower High and Lower Low.
To ignore small noise, a swing only counts when it's at least a set percentage of your A→B range. You can change this in settings with "Min swing size", which defaults to 30%. Raise it for fewer, bigger swings, or lower it for more detail.
Highs and lows always alternate, so you get a clean structure instead of every small wiggle.
HOW TO USE IT
Find a clear swing on your timeframe.
Click Point A at the start of the swing and Point B at the end.
Watch whether the pullback forms its swing (HL in an uptrend, LH in a downtrend) inside the 25%–75% zone.
If the status turns red, the pullback went too deep. Ignore that swing and wait for a new one.
What you do from there, and how you confirm it, is your own decision and analysis.
SETTINGS
Swing points: Point A and Point B (time and price)
Style: zone fill, 25%/75% line colour, 50% line, range box colours, show prices, show status label, badge position
Market structure: show or hide labels, minimum swing size, colours for bullish and bearish labels
NOTES
The levels move only when you move Point A or Point B, so nothing repaints on its own.
Works on any symbol and any timeframe.
This is a drawing and measuring tool for chart analysis. It is not financial advice, and past price behaviour does not guarantee future results.
It does not choose swings for you and it does not give buy or sell signals. It shows where price is relative to a swing you chose.
HOW IT WORKS
1. Point A and Point B
When you add the indicator to the chart, TradingView asks you to click two points:
Point A: the start of the swing (swing low for an up-move, swing high for a down-move)
Point B: the end of the swing (the latest swing high or low)
You can change both points at any time in the indicator settings, or by removing the indicator and adding it again.
2. Range box and levels
A box is drawn from Point A to Point B, like a date range. The pullback from Point B back toward Point A is measured, and these levels are drawn:
25% and 75%: the edges of the zone (solid lines)
50%: the midpoint (dashed, optional)
The area between 25% and 75% is shaded as the zone.
Each level has a label on the right with its price (prices are optional). A small label at Point B shows the size of the swing in % and the number of bars from A to B.
3. Live pullback status
A label next to the current price shows how deep the pullback is right now:
Grey: the pullback hasn't reached 25% yet
Gold: price is inside the 25%–75% zone
Red, INVALID: price has gone beyond 75% of the swing
INVALID uses the deepest wick since Point B, so once it appears it stays, even if price comes back into the zone. That swing is no longer valid, and you should draw a new one.
4. Market structure (HH / HL / LH / LL)
Starting from Point A only, the indicator labels the major swings as Higher High, Higher Low, Lower High and Lower Low.
To ignore small noise, a swing only counts when it's at least a set percentage of your A→B range. You can change this in settings with "Min swing size", which defaults to 30%. Raise it for fewer, bigger swings, or lower it for more detail.
Highs and lows always alternate, so you get a clean structure instead of every small wiggle.
HOW TO USE IT
Find a clear swing on your timeframe.
Click Point A at the start of the swing and Point B at the end.
Watch whether the pullback forms its swing (HL in an uptrend, LH in a downtrend) inside the 25%–75% zone.
If the status turns red, the pullback went too deep. Ignore that swing and wait for a new one.
What you do from there, and how you confirm it, is your own decision and analysis.
SETTINGS
Swing points: Point A and Point B (time and price)
Style: zone fill, 25%/75% line colour, 50% line, range box colours, show prices, show status label, badge position
Market structure: show or hide labels, minimum swing size, colours for bullish and bearish labels
NOTES
The levels move only when you move Point A or Point B, so nothing repaints on its own.
Works on any symbol and any timeframe.
This is a drawing and measuring tool for chart analysis. It is not financial advice, and past price behaviour does not guarantee future results.
הערות שחרור
RLT Snapback · RAYLIGHT TRADESRLT Snapback automatically marks the latest swing on your chart and draws the 25%–75% pullback zone of that swing, so you can see at a glance where a healthy pullback sits.
HOW IT WORKS
- Automatic swings – the indicator finds the swing low and swing high (or swing high and swing low) on its own. No clicking or manual points needed.
- Point A → Point B – the newest confirmed swing is drawn as a range box from swing to swing, with the % move and bar count.
- 25% / 50% / 75% levels – measured from Point B back toward Point A. The zone between 25% and 75% is shaded and extends to the right.
- Market structure – HH, HL, LH and LL labels on confirmed swings.
- Live status – shows whether price is still pulling back, is inside the 25–75% zone, or has gone beyond 75% (setup invalid).
NO REPAINT
Swings are confirmed on closed candles only. A swing is locked once price has pulled back a set percentage of the move (default 20%), and after that it never moves. Because of this, a new swing appears shortly after the turn, never at the exact top or bottom in real time.
SETTINGS
- Min swing size (× ATR) – higher values show only bigger swings (default 5).
- Lock swing after pullback (%) – how much pullback is needed to confirm a swing (5–25%, default 20%).
- ATR length, colours, 50% line, price labels, status label and badge position.
ALERTS
- Price entered the 25–75% zone
- New swing locked
Both fire on candle close.
IMPORTANT
This indicator does not give buy/sell, CALL/PUT or entry signals. It only marks swings, structure and the pullback zone. All trading decisions are your own. Trading involves risk; use proper risk management.

כתב ויתור
המידע והפרסומים אינם מיועדים להיות, ואינם מהווים, ייעוץ או המלצה פיננסית, השקעתית, מסחרית או מכל סוג אחר המסופקת או מאושרת על ידי TradingView. קרא עוד ב־תנאי השימוש.
כתב ויתור
המידע והפרסומים אינם מיועדים להיות, ואינם מהווים, ייעוץ או המלצה פיננסית, השקעתית, מסחרית או מכל סוג אחר המסופקת או מאושרת על ידי TradingView. קרא עוד ב־תנאי השימוש.