OPEN-SOURCE SCRIPT
Previous Periods Highs and Lows + Labels
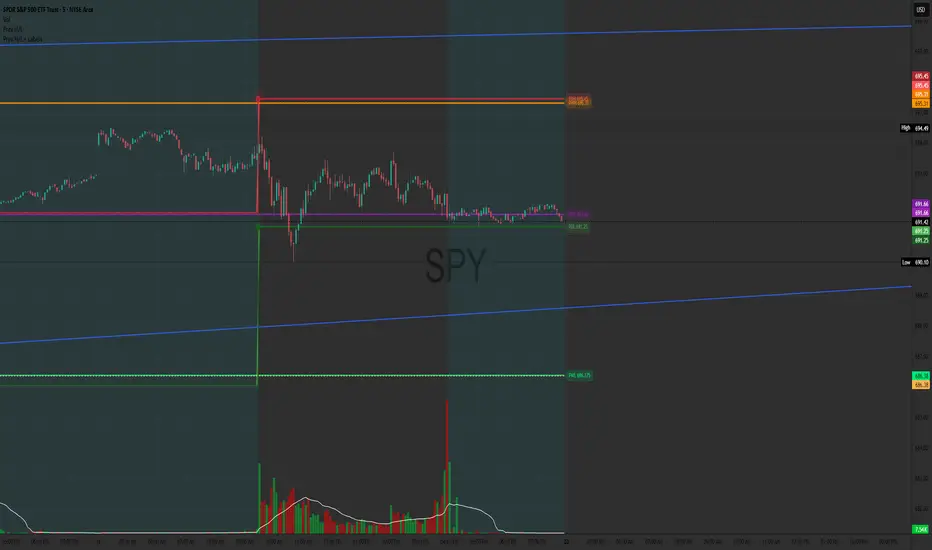
This indicator plots the high and low prices from the previous Day, Week, and Month as horizontal lines on any timeframe chart. It provides clear visual reference to key historical support and resistance levels commonly used by traders for: breakout and reversal identification
stop-loss placement
target setting
Features include distinct colors for each period and optional price labels displayed on the right side of the chart for quick reference.Simple, non-repainting, and optimized for both intraday and swing trading setups.
stop-loss placement
target setting
Features include distinct colors for each period and optional price labels displayed on the right side of the chart for quick reference.Simple, non-repainting, and optimized for both intraday and swing trading setups.
סקריפט קוד פתוח
ברוח האמיתית של TradingView, יוצר הסקריפט הזה הפך אותו לקוד פתוח, כך שסוחרים יוכלו לעיין בו ולאמת את פעולתו. כל הכבוד למחבר! אמנם ניתן להשתמש בו בחינם, אך זכור כי פרסום חוזר של הקוד כפוף ל־כללי הבית שלנו.

כתב ויתור
המידע והפרסומים אינם מיועדים להיות, ואינם מהווים, ייעוץ או המלצה פיננסית, השקעתית, מסחרית או מכל סוג אחר המסופקת או מאושרת על ידי TradingView. קרא עוד ב־תנאי השימוש.
סקריפט קוד פתוח
ברוח האמיתית של TradingView, יוצר הסקריפט הזה הפך אותו לקוד פתוח, כך שסוחרים יוכלו לעיין בו ולאמת את פעולתו. כל הכבוד למחבר! אמנם ניתן להשתמש בו בחינם, אך זכור כי פרסום חוזר של הקוד כפוף ל־כללי הבית שלנו.
כתב ויתור
המידע והפרסומים אינם מיועדים להיות, ואינם מהווים, ייעוץ או המלצה פיננסית, השקעתית, מסחרית או מכל סוג אחר המסופקת או מאושרת על ידי TradingView. קרא עוד ב־תנאי השימוש.