OPEN-SOURCE SCRIPT
Globex HOD/LOD 3-Ticker Dashboard
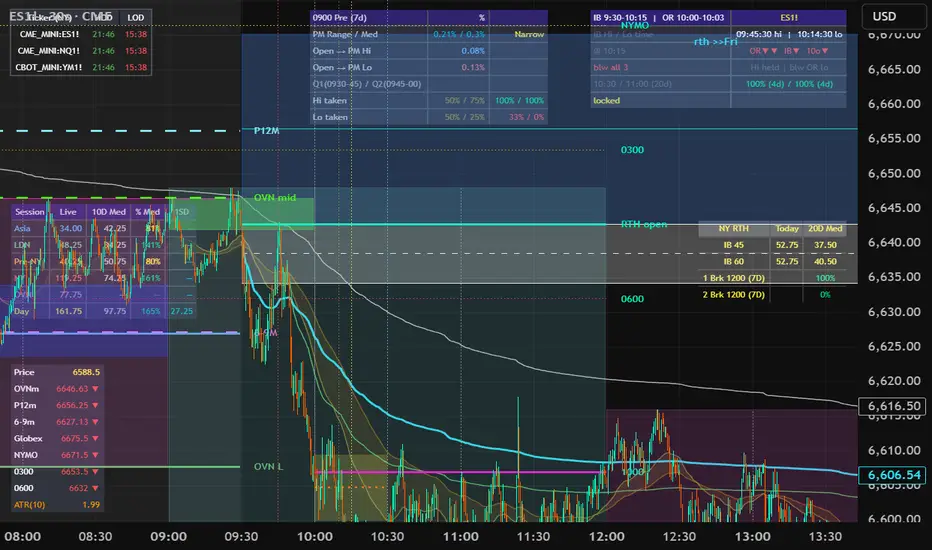
Globex HOD/LOD 3-Ticker Dashboard [Correlation Engine]
The Globex HOD/LOD Dashboard is a specialized monitoring tool designed for multi-asset traders who need to track exactly when the High of Day (HOD) and Low of Day (LOD) were formed across different correlated markets.
By comparing the timestamps of highs and lows across assets like NQ, ES, and YM (or Gold and Oil), traders can instantly identify SMT Divergence—a powerful institutional signal where one asset makes a lower-low while a correlated asset fails to do so.
Key Features
Triple-Ticker Monitoring: Track three custom symbols simultaneously from a single chart (e.g., NQ, ES, and DXY).
Precise NY Timestamps: All HOD/LOD times are automatically converted to America/New_York time, ensuring you are synced with the CME Globex cycle regardless of your local time.
Smart Reset Logic: The dashboard resets exactly at 18:00:00 NY (the Globex open), providing a clean slate for each new trading day.
Sub-Minute Accuracy: Optimized to capture price peaks on ultra-fast timeframes (like 30-second bars) without missing the exact second a high or low is printed.
The Dashboard Layout
Ticker (NY): Displays your chosen symbols.
HOD (Green): The exact time (HH:mm) the highest price was reached since the 18:00 Globex open.
LOD (Red): The exact time (HH:mm) the lowest price was reached since the 18:00 Globex open.
Strategic Use Cases
Detecting SMT Divergence: If ES printed its LOD at 08:30 AM, but NQ printed a newer LOD at 09:30 AM, you have a clear divergence. This dashboard lets you see those timestamp mismatches at a glance without switching charts.
Timing the Turn: Institutional "reversal" windows often occur when multiple correlated assets print their highs or lows within the same 5-10 minute window. This tool identifies that confluence in real-time.
London/NY Session Overlap: Easily identify if the HOD was set during the London session or if the New York open is currently driving a trend expansion.
Technical Settings
Ticker Inputs: Fully customizable. You can track Indices, FX Pairs, or Commodities.
Timezone: Fixed to America/New_York for professional institutional alignment.
Placement: Positioned in the Top Left to provide an unobtrusive "heads-up display" while you focus on the price action.
Disclaimer: Timing of highs and lows is a historical record of the current session. Use this data to identify market structure shifts and inter-market correlations.
The Globex HOD/LOD Dashboard is a specialized monitoring tool designed for multi-asset traders who need to track exactly when the High of Day (HOD) and Low of Day (LOD) were formed across different correlated markets.
By comparing the timestamps of highs and lows across assets like NQ, ES, and YM (or Gold and Oil), traders can instantly identify SMT Divergence—a powerful institutional signal where one asset makes a lower-low while a correlated asset fails to do so.
Key Features
Triple-Ticker Monitoring: Track three custom symbols simultaneously from a single chart (e.g., NQ, ES, and DXY).
Precise NY Timestamps: All HOD/LOD times are automatically converted to America/New_York time, ensuring you are synced with the CME Globex cycle regardless of your local time.
Smart Reset Logic: The dashboard resets exactly at 18:00:00 NY (the Globex open), providing a clean slate for each new trading day.
Sub-Minute Accuracy: Optimized to capture price peaks on ultra-fast timeframes (like 30-second bars) without missing the exact second a high or low is printed.
The Dashboard Layout
Ticker (NY): Displays your chosen symbols.
HOD (Green): The exact time (HH:mm) the highest price was reached since the 18:00 Globex open.
LOD (Red): The exact time (HH:mm) the lowest price was reached since the 18:00 Globex open.
Strategic Use Cases
Detecting SMT Divergence: If ES printed its LOD at 08:30 AM, but NQ printed a newer LOD at 09:30 AM, you have a clear divergence. This dashboard lets you see those timestamp mismatches at a glance without switching charts.
Timing the Turn: Institutional "reversal" windows often occur when multiple correlated assets print their highs or lows within the same 5-10 minute window. This tool identifies that confluence in real-time.
London/NY Session Overlap: Easily identify if the HOD was set during the London session or if the New York open is currently driving a trend expansion.
Technical Settings
Ticker Inputs: Fully customizable. You can track Indices, FX Pairs, or Commodities.
Timezone: Fixed to America/New_York for professional institutional alignment.
Placement: Positioned in the Top Left to provide an unobtrusive "heads-up display" while you focus on the price action.
Disclaimer: Timing of highs and lows is a historical record of the current session. Use this data to identify market structure shifts and inter-market correlations.
סקריפט קוד פתוח
ברוח האמיתית של TradingView, יוצר הסקריפט הזה הפך אותו לקוד פתוח, כך שסוחרים יוכלו לעיין בו ולאמת את פעולתו. כל הכבוד למחבר! אמנם ניתן להשתמש בו בחינם, אך זכור כי פרסום חוזר של הקוד כפוף ל־כללי הבית שלנו.

כתב ויתור
המידע והפרסומים אינם מיועדים להיות, ואינם מהווים, ייעוץ או המלצה פיננסית, השקעתית, מסחרית או מכל סוג אחר המסופקת או מאושרת על ידי TradingView. קרא עוד ב־תנאי השימוש.
סקריפט קוד פתוח
ברוח האמיתית של TradingView, יוצר הסקריפט הזה הפך אותו לקוד פתוח, כך שסוחרים יוכלו לעיין בו ולאמת את פעולתו. כל הכבוד למחבר! אמנם ניתן להשתמש בו בחינם, אך זכור כי פרסום חוזר של הקוד כפוף ל־כללי הבית שלנו.
כתב ויתור
המידע והפרסומים אינם מיועדים להיות, ואינם מהווים, ייעוץ או המלצה פיננסית, השקעתית, מסחרית או מכל סוג אחר המסופקת או מאושרת על ידי TradingView. קרא עוד ב־תנאי השימוש.