DKJ H/L Levels 2.0
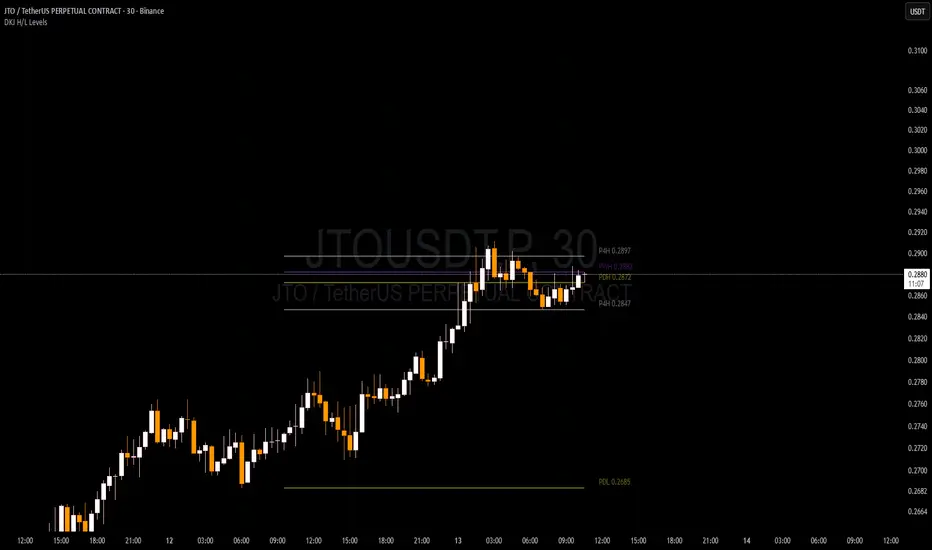
Previous High & Low Levels — 4H | Daily | Weekly | Monthly
Price action trading, Support & resistance, Mean reversal.
Updated version of DKJ H/L Levels
A clean, minimal indicator that plots the previous high and low for four key timeframes — 4H, Daily, Weekly, and Monthly — directly on your chart.
Levels are displayed as horizontal lines extending left from the current bar, with price labels neatly aligned at the right edge. Designed to give you an immediate read on the most relevant institutional reference points without cluttering the chart.
Features:
Previous 4H, Daily, Weekly and Monthly highs and lows
Fully adjustable line width, style, and length
Customisable colours per timeframe
Label size and vertical position (above/below) controls
Built-in alerts for price crossing any level
Best used on: 4H charts and below — 30m and 1H being the sweet spot.
Setting alerts:
Right-click the indicator name on your chart and select Add alert, or open the Alerts panel and create a new alert
In the Condition dropdown, select DKJ H/L Levels
Choose Any alert() function call — this covers all timeframes and directions in one alert
Set your notification method and click Create
Each alert will fire once per bar and tell you exactly which level was crossed and in which direction.
Price action trading, Support & resistance, Mean reversal.
Updated version of DKJ H/L Levels
A clean, minimal indicator that plots the previous high and low for four key timeframes — 4H, Daily, Weekly, and Monthly — directly on your chart.
Levels are displayed as horizontal lines extending left from the current bar, with price labels neatly aligned at the right edge. Designed to give you an immediate read on the most relevant institutional reference points without cluttering the chart.
Features:
Previous 4H, Daily, Weekly and Monthly highs and lows
Fully adjustable line width, style, and length
Customisable colours per timeframe
Label size and vertical position (above/below) controls
Built-in alerts for price crossing any level
Best used on: 4H charts and below — 30m and 1H being the sweet spot.
Setting alerts:
Right-click the indicator name on your chart and select Add alert, or open the Alerts panel and create a new alert
In the Condition dropdown, select DKJ H/L Levels
Choose Any alert() function call — this covers all timeframes and directions in one alert
Set your notification method and click Create
Each alert will fire once per bar and tell you exactly which level was crossed and in which direction.

כתב ויתור
המידע והפרסומים אינם מיועדים להיות, ואינם מהווים, ייעוץ או המלצה פיננסית, השקעתית, מסחרית או מכל סוג אחר המסופקת או מאושרת על ידי TradingView. קרא עוד ב־תנאי השימוש.
כתב ויתור
המידע והפרסומים אינם מיועדים להיות, ואינם מהווים, ייעוץ או המלצה פיננסית, השקעתית, מסחרית או מכל סוג אחר המסופקת או מאושרת על ידי TradingView. קרא עוד ב־תנאי השימוש.