Aurora Glow [JOAT]
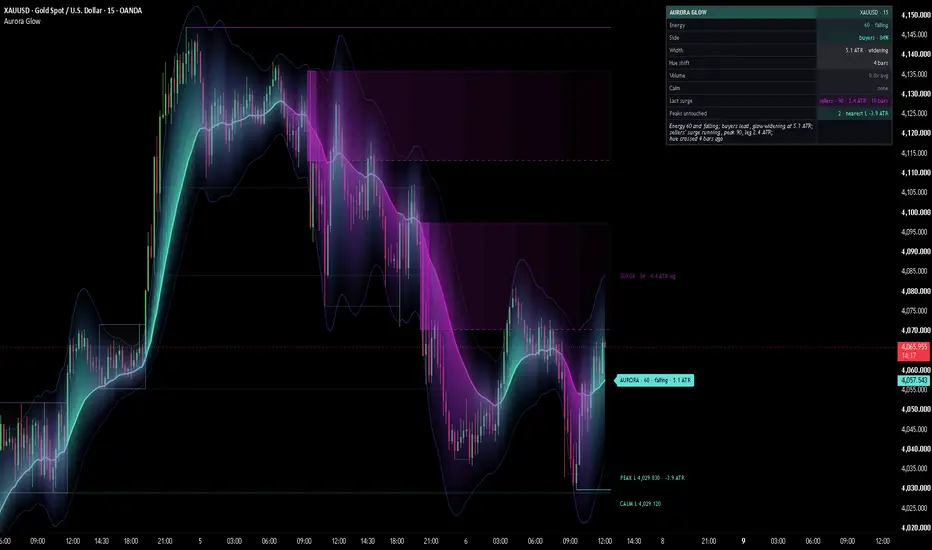
Aurora Glow is an open-source overlay that draws momentum as light, then maps what that momentum did onto the chart. A centre line (an EMA) carries a layered glow above and below it, like a curtain of northern lights behind price. The glow grows wider and brighter when momentum builds, fades to a thin haze when it dies, and slowly changes colour as the balance between buyers and sellers shifts: cyan and green tones while buyers push, magenta and violet tones while sellers do. A crisp thin outline traces the outer edge of the light.
On top of the glow sits a mapped layer drawn from the same energy reading: CALM boxes where the market compressed, SURGE zones at the base each burst of energy left from, and PEAK rails at the extreme each burst reached. Every box and rail carries its numbers on a short tag at the right edge, and a narrow dashboard reads the same numbers back. There is not a single arrow, dot or buy / sell marker on the chart.
Core Concepts
1. Energy (0-100)
Energy combines three parts of momentum into one reading: speed (how many RSI points RSI moved over the last few bars), participation (volume relative to its average) and range expansion (a fast ATR over a slow ATR). They are multiplied, so the reading is only high when the move is fast, carried by volume and widening the bars at the same time. The smoothed result is then ranked against its own last 200 bars, so 78 means "stronger than 78 % of that window" on any market and timeframe. Every part of the map below is built from this one number.
Pine Script®
2. Width and brightness
Each side of the glow is ATR x (calm width + energy x extra width). The side the momentum pushes toward stretches further and the other side is pulled in a little, so the aurora leans in the direction of the energy. Brightness follows energy too: the glow is faint at zero energy and strongest at the centre line at full energy.
3. The hue
The colour follows a smoothed energy-direction score built from the RSI slope, the RSI level and the close's side of the centre line, weighted by energy and scaled against its own recent extreme. Because the close and RSI turn before an average does, the colour usually drifts across its neutral mid-hue before the centre line itself turns. Around balance the two colours blend into a cool mid-hue (periwinkle in the default theme) instead of grey.
4. The layers and the outline
Five gradient layers sit on each side (three to five, adjustable). The hue moves from the inner colour near the centre line to an outer colour at the edge (cyan to azure for buyers, magenta to violet for sellers) and the opacity falls off on a curve, so the light is densest at the centre and fades to nothing at the outer edge. The outermost edge on each side is drawn as a thin line in the current outer hue: softer in a quiet market and on the side against the momentum.
5. CALM boxes (compression)
When energy stays below 25 for at least 10 closed bars, the market is compressed. A box is drawn over the high and low of those bars in the aurora's mid-hue, with a soft nested gradient that is densest along its middle and a thin crisp border, tagged "CALM · 18 bars · 1.2 ATR" (bars in the box and its height in ATR). The box keeps growing while candles close inside it. The first close outside freezes it: the tag goes, the box dims, and its high and low continue to the right as thin dotted rails, "CALM H 27,040.00" in the bear role colour and "CALM L 26,980.25" in the bull role colour. The first wick through a rail stops it there as a dim stub with no text. An edge the breakout candle itself traded through gets no rail.
6. SURGE origin zones
When energy crosses above 80, a surge starts. Its base is the range of the 3 bars before it, drawn as a glowing zone in the side colour: the bull role colour when the energy-direction score was positive at the surge's first bar, the bear role colour when it was negative. The zone has a nested gradient that is strongest at the base and fades to the right, a solid near edge with a soft glow under it, a faint dotted far edge and the base candles outlined. Its tag reads "SURGE · 92 · 2.1 ATR leg": the surge's peak energy and the leg from the base to the surge's extreme, updated while the surge runs and frozen once energy closes below 60. Fresh zones are bright; once price trades back inside, the zone turns tested (dimmer, dashed, thinner edge); a close through the far side breaks it (grey dotted outline, no text).
7. PEAK levels
The extreme each surge reached (the highest high of a buyers' surge, the lowest low of a sellers' surge) is drawn as a rail from that bar to the right edge: "PEAK H 27,180.50 · +1.4 ATR" in the bear role colour, "PEAK L" in the bull role colour, with the signed distance from the close. The rail follows the extreme while the surge runs. After the surge ends, the first wick through it stops it there as a dim stub with no text.
Features
Input Parameters
Aurora:
Energy:
Aurora colours:
Plate:
Calm boxes (compression):
Surge zones:
Peak levels:
Outline:
Map look and tags:
Theme:
Dashboard:
Candles:
How to Use This Indicator
Reading the glow
A thin, faint aurora describes a quiet market with little energy behind it. A wide, bright one describes a move that is fast, carried by volume and expanding the bars. Watch the change more than the level: a glow that keeps widening describes momentum that is still building, a glow that shrinks while price keeps going describes a move losing its fuel.
Reading the colour
Cyan and green tones mean the energy leans to buyers, magenta and violet to sellers, the cool mid-hue means balance. A slow drift of colour across the mid-hue while the centre line still points the old way describes momentum changing sides underneath an average that has not caught up yet.
Reading a CALM box
A live CALM box marks a stretch where energy has been in the bottom quarter of its recent range and every candle has closed inside the box. Its tag tells you how long the compression has lasted and how tall it is in ATR: a long, tight box describes a market that has gone very quiet. When a close leaves the box it freezes, and the edges that were not traded through stay on the chart as CALM H / CALM L rails, the untouched edges of that compression. A rail that ends in a dim stub has been traded through.
Reading a SURGE zone
A SURGE zone marks the area a burst of energy left from, in the colour of the side the energy leaned to. The tag gives the strongest energy reading of that burst and how far it travelled from its base in ATR. A fresh zone has not been revisited; a tested zone (dimmer, dashed edge) has had price back inside it; a grey dotted outline is a zone a candle has closed through.
Reading a PEAK rail
A PEAK rail marks how far a surge went: PEAK H above for a buyers' surge, PEAK L below for a sellers' surge, with the distance from the current close in ATR (+ above, - below). While its surge runs the rail moves with it; after that it stays until a wick trades through it.
Reading the plate and the dashboard
The plate and the dashboard carry the same numbers as the chart. Calm shows the live box (bars · height), Last surge shows side · peak energy · leg · bars since it started, and Peaks untouched counts the rails still standing with the nearest one's distance. Hover any row for what it measures and how traders usually read it. The Read line sums the state up from those numbers.
Indicator Limitations
Originality Statement
Disclaimer
This indicator is provided for educational and informational purposes only. It is not financial advice and it does not give buy or sell signals. Trading involves substantial risk of loss. The energy, the hue, the calm boxes, the surge zones and the peak levels describe how momentum and price have behaved and do not predict future price behaviour. The author accepts no responsibility for trading losses resulting from use of this indicator.
Made with passion by jackofalltrades
On top of the glow sits a mapped layer drawn from the same energy reading: CALM boxes where the market compressed, SURGE zones at the base each burst of energy left from, and PEAK rails at the extreme each burst reached. Every box and rail carries its numbers on a short tag at the right edge, and a narrow dashboard reads the same numbers back. There is not a single arrow, dot or buy / sell marker on the chart.
Core Concepts
1. Energy (0-100)
Energy combines three parts of momentum into one reading: speed (how many RSI points RSI moved over the last few bars), participation (volume relative to its average) and range expansion (a fast ATR over a slow ATR). They are multiplied, so the reading is only high when the move is fast, carried by volume and widening the bars at the same time. The smoothed result is then ranked against its own last 200 bars, so 78 means "stronger than 78 % of that window" on any market and timeframe. Every part of the map below is built from this one number.
2. Width and brightness
Each side of the glow is ATR x (calm width + energy x extra width). The side the momentum pushes toward stretches further and the other side is pulled in a little, so the aurora leans in the direction of the energy. Brightness follows energy too: the glow is faint at zero energy and strongest at the centre line at full energy.
3. The hue
The colour follows a smoothed energy-direction score built from the RSI slope, the RSI level and the close's side of the centre line, weighted by energy and scaled against its own recent extreme. Because the close and RSI turn before an average does, the colour usually drifts across its neutral mid-hue before the centre line itself turns. Around balance the two colours blend into a cool mid-hue (periwinkle in the default theme) instead of grey.
4. The layers and the outline
Five gradient layers sit on each side (three to five, adjustable). The hue moves from the inner colour near the centre line to an outer colour at the edge (cyan to azure for buyers, magenta to violet for sellers) and the opacity falls off on a curve, so the light is densest at the centre and fades to nothing at the outer edge. The outermost edge on each side is drawn as a thin line in the current outer hue: softer in a quiet market and on the side against the momentum.
5. CALM boxes (compression)
When energy stays below 25 for at least 10 closed bars, the market is compressed. A box is drawn over the high and low of those bars in the aurora's mid-hue, with a soft nested gradient that is densest along its middle and a thin crisp border, tagged "CALM · 18 bars · 1.2 ATR" (bars in the box and its height in ATR). The box keeps growing while candles close inside it. The first close outside freezes it: the tag goes, the box dims, and its high and low continue to the right as thin dotted rails, "CALM H 27,040.00" in the bear role colour and "CALM L 26,980.25" in the bull role colour. The first wick through a rail stops it there as a dim stub with no text. An edge the breakout candle itself traded through gets no rail.
6. SURGE origin zones
When energy crosses above 80, a surge starts. Its base is the range of the 3 bars before it, drawn as a glowing zone in the side colour: the bull role colour when the energy-direction score was positive at the surge's first bar, the bear role colour when it was negative. The zone has a nested gradient that is strongest at the base and fades to the right, a solid near edge with a soft glow under it, a faint dotted far edge and the base candles outlined. Its tag reads "SURGE · 92 · 2.1 ATR leg": the surge's peak energy and the leg from the base to the surge's extreme, updated while the surge runs and frozen once energy closes below 60. Fresh zones are bright; once price trades back inside, the zone turns tested (dimmer, dashed, thinner edge); a close through the far side breaks it (grey dotted outline, no text).
7. PEAK levels
The extreme each surge reached (the highest high of a buyers' surge, the lowest low of a sellers' surge) is drawn as a rail from that bar to the right edge: "PEAK H 27,180.50 · +1.4 ATR" in the bear role colour, "PEAK L" in the bull role colour, with the signed distance from the close. The rail follows the extreme while the surge runs. After the surge ends, the first wick through it stops it there as a dim stub with no text.
Features
- Layered aurora glow: up to 5 gradient layers above and 5 below the centre line, curved opacity fade, inner-to-outer hue drift
- Glow outline: a crisp thin line on the outermost edge of each side in the current outer hue
- Energy-driven width and brightness: the glow widens and brightens as energy builds and shrinks to a haze when it dies
- Momentum-side stretch: the side the energy leans to reaches further, the other side is pulled in and dimmed
- Leading hue: the colour drifts with a smoothed energy-direction score, usually before the centre line turns
- CALM boxes: compression boxes that grow while price closes inside them, then leave CALM H / CALM L rails until a wick sweeps them
- SURGE origin zones: the base of each energy burst as a glowing zone with a fresh / tested / broken lifecycle and an origin block
- PEAK rails: the extreme of each surge with its signed ATR distance from the close
- Clean history: frozen boxes lose their tags, swept rails become dim stubs, broken zones become grey outlines; every layer keeps only its newest few objects
- One lane for every tag: the plate and all map tags are spaced in one pass that keeps price order, with a gap that scales with the price span; tags the dashboard would cover are listed in its tooltips instead
- Right-end plate: "AURORA · 78 · rising · 1.6 ATR" (energy, its direction and the glow width), with the exact width above and below in the tooltip
- Dashboard: Energy, Side, Width, Hue shift, Volume, Calm, Last surge, Peaks untouched and a Read line; every row has a tooltip explaining what it measures and how traders read it; compact mode for phones
- Candle paint: Score (by the energy-direction score), Mono or Off (default Off)
- Themes: JOAT Signature, Midnight Blue / Red, Aurora Night, Delta Cyan / Pink, Paper & Ink (black / white), Lime Ember and Custom; automatic light / dark chart handling and a brightness slider
- No signals: no arrows, no dots, no crossover markers, no buy or sell labels
- Built for free accounts: no request calls, every map decision on closed bars, nothing anchored beyond the 5,000-bar history
Input Parameters
Aurora:
- Centre line source / EMA length (default: close, 21)
- Centre line width: 1-4 (default: 2)
- Glow / layers per side: 3-5 (default: on, 5)
- Calm width / energy extra (ATR per side) (default: 0.7 / 1.8); the widths are smoothed over 8 bars so the glow breathes instead of flickering
- Momentum-side stretch: 0-2 (default: 0.8)
- Glow strength at peak energy: transparency at the centre line at energy 100, lower is stronger (default: 22)
Energy:
- Percentile window (bars) (default: 200)
- RSI length / slope bars (default: 14 / 3)
- Volume average length (default: 20)
- Energy / hue smoothing (default: 5 / 8)
Aurora colours:
- Custom outer bull / bear: the outer hues, used by the Custom theme only
Plate:
- Data plate at the right end / bars right (default: on, 3); every map tag sits in the same column and the live rails and zones end one bar before it
Calm boxes (compression):
- Calm boxes (default: on)
- Calm when energy is below / for at least (bars) (default: 25 / 10)
- CALM H / CALM L rails after the freeze (default: on)
- Calm boxes kept: 1-6 (default: 3, the live box included)
Surge zones:
- Surge origin zones (default: on)
- Surge when energy crosses above / ends below (default: 80 / 60); the end level is kept at least 1 below the start level
- Base bars before the surge: 1-10 (default: 3)
- Max base height (ATR): a taller base, such as one containing a crash candle, is trimmed to this height from its extreme (default: 2.0)
- Retire zones / peaks farther than (ATR): finished surge zones, broken outlines, peak levels and stubs, and frozen calm boxes this far from the close are removed so they cannot squash the price scale; 0 = never (default: 12)
- Live zones kept per side / broken outlines kept (default: 3 / 2); a new zone replaces an older zone of the same side that it overlaps
Peak levels:
- PEAK H / PEAK L rails (default: on)
- Peak levels kept: 1-6 (default: 3 untouched rails, and as many swept stubs)
Outline:
- Outline the outer glow edge / strength (default: on, 35; the number is the transparency at full energy, lower is stronger)
- Outline width: 1-3 (default: 1)
Map look and tags:
- Gradient steps: 3-10 (default: 6), the nested boxes in each calm box and surge zone
- Zone fill strength (transparency) (default: 70); calm boxes are 6 softer, tested zones 12 softer, frozen calm boxes 16 softer
- Tag size: Small or Normal (default: Small)
- Tag lane gap (ATR) (default: 0.6); the gap used is the larger of this and 1/38 of the price span at the right edge
Theme:
- Theme (default: JOAT Signature), Brightness 1-5 (default: 3), Chart background Auto / Dark / Light
- Custom bull / bear, accent / neutral, text / panel and glow colours (used by the Custom theme)
Dashboard:
- Show dashboard, Dashboard position (default: Top Right), Dashboard size (default: Small), Compact dashboard, Tinted value cells
Candles:
- Candle paint: Off, Score or Mono (default: Off)
How to Use This Indicator
Reading the glow
A thin, faint aurora describes a quiet market with little energy behind it. A wide, bright one describes a move that is fast, carried by volume and expanding the bars. Watch the change more than the level: a glow that keeps widening describes momentum that is still building, a glow that shrinks while price keeps going describes a move losing its fuel.
Reading the colour
Cyan and green tones mean the energy leans to buyers, magenta and violet to sellers, the cool mid-hue means balance. A slow drift of colour across the mid-hue while the centre line still points the old way describes momentum changing sides underneath an average that has not caught up yet.
Reading a CALM box
A live CALM box marks a stretch where energy has been in the bottom quarter of its recent range and every candle has closed inside the box. Its tag tells you how long the compression has lasted and how tall it is in ATR: a long, tight box describes a market that has gone very quiet. When a close leaves the box it freezes, and the edges that were not traded through stay on the chart as CALM H / CALM L rails, the untouched edges of that compression. A rail that ends in a dim stub has been traded through.
Reading a SURGE zone
A SURGE zone marks the area a burst of energy left from, in the colour of the side the energy leaned to. The tag gives the strongest energy reading of that burst and how far it travelled from its base in ATR. A fresh zone has not been revisited; a tested zone (dimmer, dashed edge) has had price back inside it; a grey dotted outline is a zone a candle has closed through.
Reading a PEAK rail
A PEAK rail marks how far a surge went: PEAK H above for a buyers' surge, PEAK L below for a sellers' surge, with the distance from the current close in ATR (+ above, - below). While its surge runs the rail moves with it; after that it stays until a wick trades through it.
Reading the plate and the dashboard
The plate and the dashboard carry the same numbers as the chart. Calm shows the live box (bars · height), Last surge shows side · peak energy · leg · bars since it started, and Peaks untouched counts the rails still standing with the nearest one's distance. Hover any row for what it measures and how traders usually read it. The Read line sums the state up from those numbers.
Indicator Limitations
- Energy is a percentile, so it is relative to the last 200 bars of the same chart: 80 on a quiet day and 80 on a news day are not the same absolute move, and a calm box on a news day can be wider than a surge base on a quiet one
- Volume comes from the chart's own bars; symbols without volume count as average volume, so only speed and range expansion move the energy
- RSI, ATR and the centre line are computed on the chart timeframe, so the same market reads differently on 1m and 1H
- The glow, plate and dashboard follow the live bar and settle when it closes; calm boxes, surge zones and peak rails are only created, grown, tested, broken or swept on closed bars, so they appear one bar after the event
- The side of a surge comes from the smoothed energy-direction score at its first bar, so a sharp turn can start a surge whose colour still shows the old side; such a zone usually breaks quickly and is drawn as a grey outline
- Each layer keeps only its newest few objects (3 calm boxes, 3 live surge zones per side, 3 peak rails by default), so older levels leave the chart even if they were never traded through
- A calm box that no close ever leaves stops growing after 500 bars
- The first ~200 bars of a chart have no full percentile window yet, and a free account loads about 5,000 bars, so the hue-shift count and the map only cover that history ("+" means no crossing was found inside it)
- In the Paper & Ink theme bull and bear share one ink colour, so direction is carried by position, the H / L in each tag and line style (PEAK H rails and the near edge of sellers' surge zones are dashed)
Originality Statement
- Energy multiplies speed, participation and range expansion and ranks the result as a percentile, so the glow only opens up when all three agree, on any market and timeframe
- The glow is asymmetric: width, brightness and the dimming of the opposite side all follow the energy-direction score, so the aurora leans toward the side the energy pushes
- The hue moves along two axes at once, bear-to-bull across the score and inner-to-outer across the layers, and blends through a cool mid-hue instead of grey around balance
- The map is drawn from the same energy reading as the glow: low energy becomes a compression box, a burst of energy becomes an origin zone and a peak level, so the boxes and rails explain what the light did
- Every dashboard number is also on the chart, through the glow, the plate and the tags on the boxes and rails
Disclaimer
This indicator is provided for educational and informational purposes only. It is not financial advice and it does not give buy or sell signals. Trading involves substantial risk of loss. The energy, the hue, the calm boxes, the surge zones and the peak levels describe how momentum and price have behaved and do not predict future price behaviour. The author accepts no responsibility for trading losses resulting from use of this indicator.
Made with passion by jackofalltrades

The Proven Highest Win Rate Trading Indicators, Strategies, Tools, + Signals !! 🃏
Get Access and See Full Results👇
jackofalltrades.vip 🌐
Get Access and See Full Results👇
jackofalltrades.vip 🌐
כתב ויתור
המידע והפרסומים אינם מיועדים להיות, ואינם מהווים, ייעוץ או המלצה פיננסית, השקעתית, מסחרית או מכל סוג אחר המסופקת או מאושרת על ידי TradingView. קרא עוד ב־תנאי השימוש.
The Proven Highest Win Rate Trading Indicators, Strategies, Tools, + Signals !! 🃏
Get Access and See Full Results👇
jackofalltrades.vip 🌐
Get Access and See Full Results👇
jackofalltrades.vip 🌐
כתב ויתור
המידע והפרסומים אינם מיועדים להיות, ואינם מהווים, ייעוץ או המלצה פיננסית, השקעתית, מסחרית או מכל סוג אחר המסופקת או מאושרת על ידי TradingView. קרא עוד ב־תנאי השימוש.