EMA Projection Ribbon
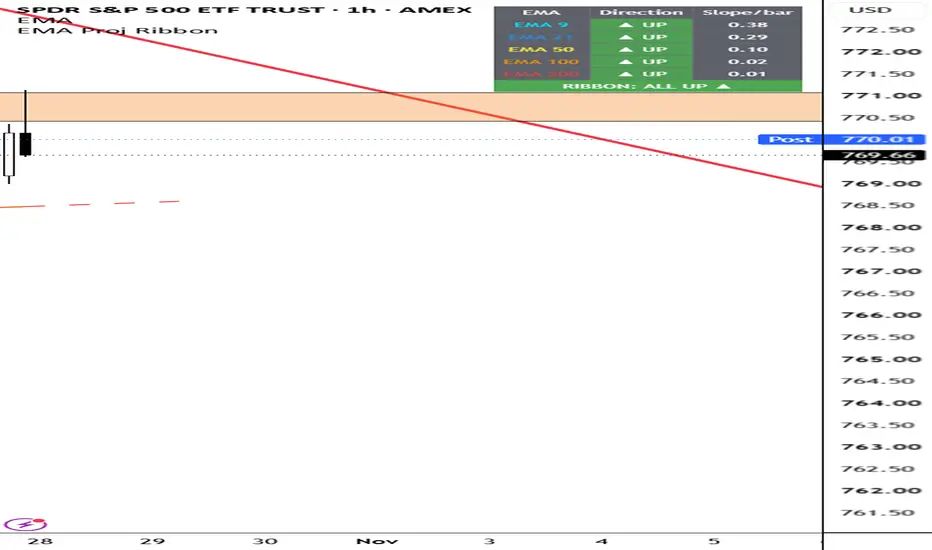
EMA Projection Ribbon plots five exponential moving averages (default 9, 21, 50, 100, 200) as a ribbon and projects each one forward so you can see where the EMAs are heading if they keep their current slope.
How it works
- Each EMA's slope is its average change per bar over a user-defined lookback (default 3 bars).
- That slope is extended forward a set number of bars (default 10) as a dashed line in the EMA's color.
- The ribbon between the EMAs is shaded green when they are stacked bullish (shorter above longer), red when stacked bearish, and gray when mixed. The projected ribbon is shaded the same way based on where the projected EMAs end up.
- A direction table shows whether each EMA is pointing UP, DOWN, or FLAT, its slope per bar, and an overall ribbon summary (ALL UP, ALL DOWN, or MIXED with a count).
Settings
- Length, color, and a Project on/off toggle for each of the five EMAs.
- Ribbon fill and projected ribbon fill on/off.
- Projection length and slope lookback.
- Direction table on/off, position, and text size.
Notes
The projection is a simple linear extension of each EMA's recent slope. It is not a prediction and does not account for future price action. Use it as a visual guide to current trend momentum alongside your own analysis.
How it works
- Each EMA's slope is its average change per bar over a user-defined lookback (default 3 bars).
- That slope is extended forward a set number of bars (default 10) as a dashed line in the EMA's color.
- The ribbon between the EMAs is shaded green when they are stacked bullish (shorter above longer), red when stacked bearish, and gray when mixed. The projected ribbon is shaded the same way based on where the projected EMAs end up.
- A direction table shows whether each EMA is pointing UP, DOWN, or FLAT, its slope per bar, and an overall ribbon summary (ALL UP, ALL DOWN, or MIXED with a count).
Settings
- Length, color, and a Project on/off toggle for each of the five EMAs.
- Ribbon fill and projected ribbon fill on/off.
- Projection length and slope lookback.
- Direction table on/off, position, and text size.
Notes
The projection is a simple linear extension of each EMA's recent slope. It is not a prediction and does not account for future price action. Use it as a visual guide to current trend momentum alongside your own analysis.

כתב ויתור
המידע והפרסומים אינם מיועדים להיות, ואינם מהווים, ייעוץ או המלצה פיננסית, השקעתית, מסחרית או מכל סוג אחר המסופקת או מאושרת על ידי TradingView. קרא עוד ב־תנאי השימוש.
כתב ויתור
המידע והפרסומים אינם מיועדים להיות, ואינם מהווים, ייעוץ או המלצה פיננסית, השקעתית, מסחרית או מכל סוג אחר המסופקת או מאושרת על ידי TradingView. קרא עוד ב־תנאי השימוש.