OPEN-SOURCE SCRIPT
Options Strikes
● Title: Options Strikes
Short description:
Visualize your open options positions on any chart — horizontal lines from entry to expiration, color-coded by Put/Call.
---
Full description:
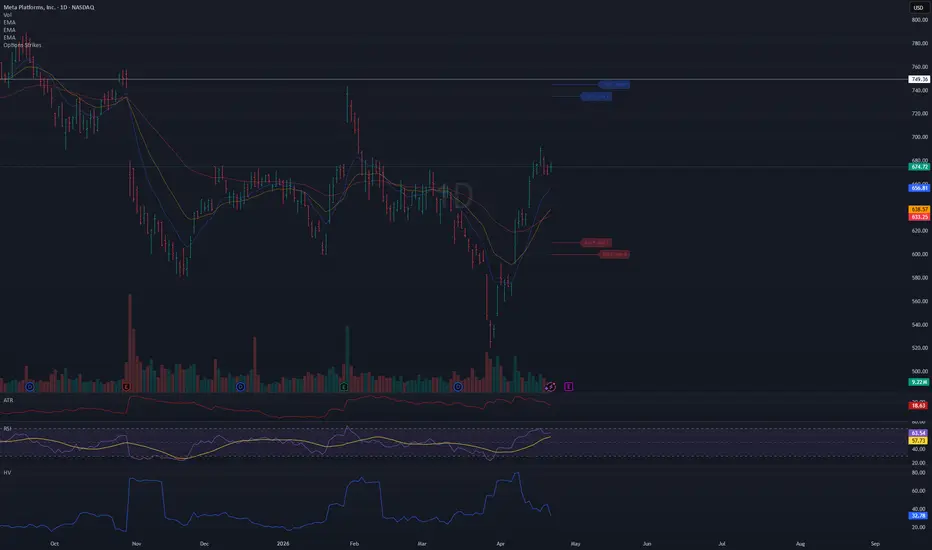
Track up to 8 options contracts directly on your price chart. Each contract draws a horizontal line from your open date to the expiration date (4:00 PM ET), so you always see where your strikes sit relative to price and how much time is left.
Features
- Up to 8 contracts simultaneously — Put and Call
- Lines run from your open date to 4:00 PM ET on expiration day
- Puts in red, Calls in blue (colors and opacity customizable)
- Compact label at the end of each line: 610 P May 1
- Labels can be toggled on/off
- Calendar pickers for both Open date and Expiration date
- Auto-enable — a contract activates as soon as you enter a Strike value; set Strike to 0 to disable it
- Ticker filter — set a symbol (e.g. META) so lines only appear on that specific chart, useful when switching between
tickers
- Works on any symbol and any timeframe
How to use
1. Add the indicator to your chart
2. Open Settings → Inputs
3. For each contract: enter a Strike, select Type (Put/Call), pick Open date and Exp date
4. The line appears automatically — no need to toggle anything
5. Optionally set the Ticker field to lock this instance to a specific symbol
Tips
- Leave Ticker blank → lines show on every chart
- Open date defaults to today — change it only if you entered the position on a previous day
- To remove a contract, set its Strike back to 0
- Use contracts 5–8 for additional positions
- Adjust colors and line width in the Style group
Short description:
Visualize your open options positions on any chart — horizontal lines from entry to expiration, color-coded by Put/Call.
---
Full description:
Track up to 8 options contracts directly on your price chart. Each contract draws a horizontal line from your open date to the expiration date (4:00 PM ET), so you always see where your strikes sit relative to price and how much time is left.
Features
- Up to 8 contracts simultaneously — Put and Call
- Lines run from your open date to 4:00 PM ET on expiration day
- Puts in red, Calls in blue (colors and opacity customizable)
- Compact label at the end of each line: 610 P May 1
- Labels can be toggled on/off
- Calendar pickers for both Open date and Expiration date
- Auto-enable — a contract activates as soon as you enter a Strike value; set Strike to 0 to disable it
- Ticker filter — set a symbol (e.g. META) so lines only appear on that specific chart, useful when switching between
tickers
- Works on any symbol and any timeframe
How to use
1. Add the indicator to your chart
2. Open Settings → Inputs
3. For each contract: enter a Strike, select Type (Put/Call), pick Open date and Exp date
4. The line appears automatically — no need to toggle anything
5. Optionally set the Ticker field to lock this instance to a specific symbol
Tips
- Leave Ticker blank → lines show on every chart
- Open date defaults to today — change it only if you entered the position on a previous day
- To remove a contract, set its Strike back to 0
- Use contracts 5–8 for additional positions
- Adjust colors and line width in the Style group
סקריפט קוד פתוח
ברוח האמיתית של TradingView, יוצר הסקריפט הזה הפך אותו לקוד פתוח, כך שסוחרים יוכלו לעיין בו ולאמת את פעולתו. כל הכבוד למחבר! אמנם ניתן להשתמש בו בחינם, אך זכור כי פרסום חוזר של הקוד כפוף ל־כללי הבית שלנו.

כתב ויתור
המידע והפרסומים אינם מיועדים להיות, ואינם מהווים, ייעוץ או המלצה פיננסית, השקעתית, מסחרית או מכל סוג אחר המסופקת או מאושרת על ידי TradingView. קרא עוד ב־תנאי השימוש.
סקריפט קוד פתוח
ברוח האמיתית של TradingView, יוצר הסקריפט הזה הפך אותו לקוד פתוח, כך שסוחרים יוכלו לעיין בו ולאמת את פעולתו. כל הכבוד למחבר! אמנם ניתן להשתמש בו בחינם, אך זכור כי פרסום חוזר של הקוד כפוף ל־כללי הבית שלנו.
כתב ויתור
המידע והפרסומים אינם מיועדים להיות, ואינם מהווים, ייעוץ או המלצה פיננסית, השקעתית, מסחרית או מכל סוג אחר המסופקת או מאושרת על ידי TradingView. קרא עוד ב־תנאי השימוש.