OPEN-SOURCE SCRIPT
Stochastic with label OVS/OVB
Stochastic Oscillator
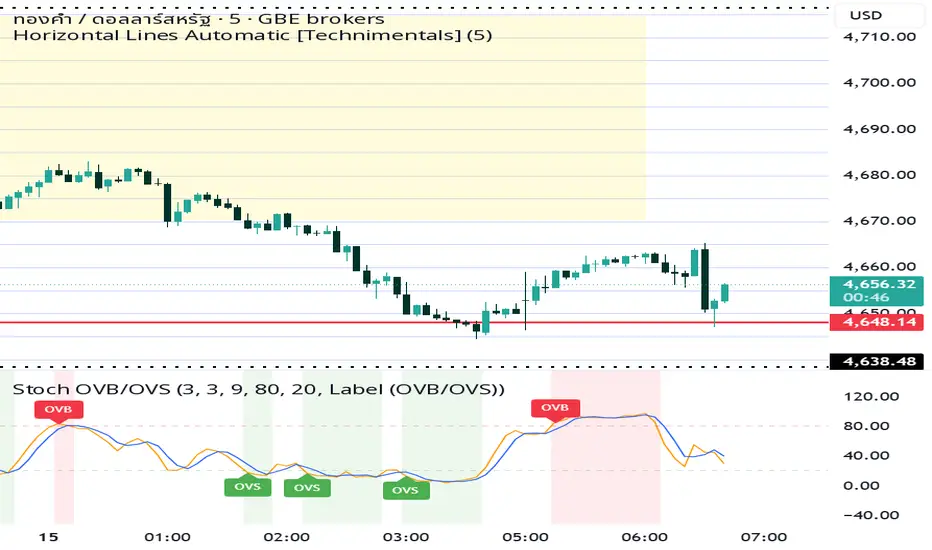
A Stochastic Oscillator indicator with OVB (Overbought) and OVS (Oversold) signal labels displayed beneath the price chart. The indicator uses two momentum lines — a blue %K line and an orange %D signal line — fluctuating between the 20 and 80 levels to identify market momentum and potential reversal zones. Red “OVB” labels appear when the oscillator enters the overbought region above 80, signaling possible bearish exhaustion, while green “OVS” labels appear below 20, indicating potential bullish reversal opportunities. The indicator is designed to help traders detect momentum shifts, trend weakness, and short-term entry or exit signals in fast-moving markets such as XAU/USD.
A Stochastic Oscillator indicator with OVB (Overbought) and OVS (Oversold) signal labels displayed beneath the price chart. The indicator uses two momentum lines — a blue %K line and an orange %D signal line — fluctuating between the 20 and 80 levels to identify market momentum and potential reversal zones. Red “OVB” labels appear when the oscillator enters the overbought region above 80, signaling possible bearish exhaustion, while green “OVS” labels appear below 20, indicating potential bullish reversal opportunities. The indicator is designed to help traders detect momentum shifts, trend weakness, and short-term entry or exit signals in fast-moving markets such as XAU/USD.
סקריפט קוד פתוח
ברוח האמיתית של TradingView, יוצר הסקריפט הזה הפך אותו לקוד פתוח, כך שסוחרים יוכלו לעיין בו ולאמת את פעולתו. כל הכבוד למחבר! אמנם ניתן להשתמש בו בחינם, אך זכור כי פרסום חוזר של הקוד כפוף ל־כללי הבית שלנו.

כתב ויתור
המידע והפרסומים אינם מיועדים להיות, ואינם מהווים, ייעוץ או המלצה פיננסית, השקעתית, מסחרית או מכל סוג אחר המסופקת או מאושרת על ידי TradingView. קרא עוד ב־תנאי השימוש.
סקריפט קוד פתוח
ברוח האמיתית של TradingView, יוצר הסקריפט הזה הפך אותו לקוד פתוח, כך שסוחרים יוכלו לעיין בו ולאמת את פעולתו. כל הכבוד למחבר! אמנם ניתן להשתמש בו בחינם, אך זכור כי פרסום חוזר של הקוד כפוף ל־כללי הבית שלנו.
כתב ויתור
המידע והפרסומים אינם מיועדים להיות, ואינם מהווים, ייעוץ או המלצה פיננסית, השקעתית, מסחרית או מכל סוג אחר המסופקת או מאושרת על ידי TradingView. קרא עוד ב־תנאי השימוש.