Volume Flow Analyzer with DMI Pressure Colors
Author: IndicatorEdge** | Pine Script™ v6
What It Does
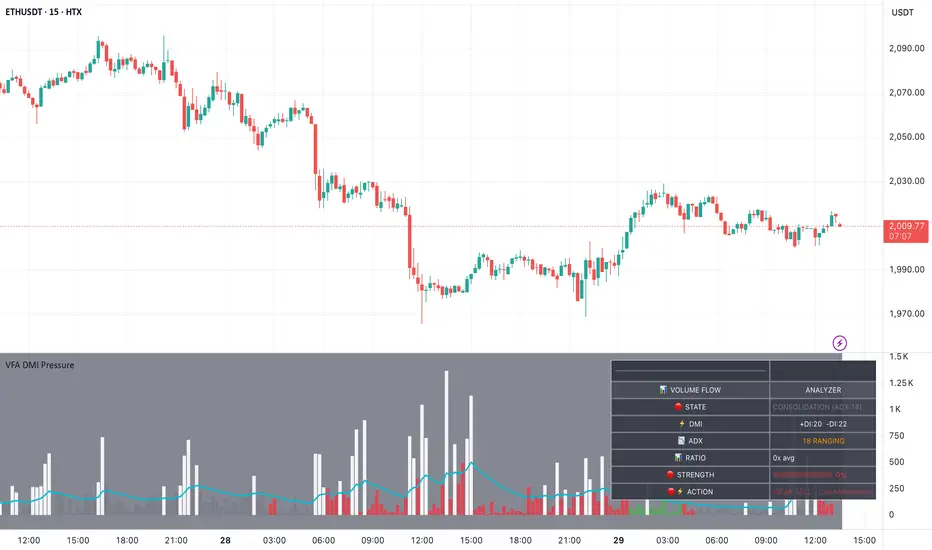
Colors volume bars GREEN (bullish) or RED (bearish) based on DMI pressure. Shows real-time trading suggestions in dashboard.
How It Works
- **+DI > -DI + ADX ≥ 20** → 🟢 BULLISH (buyers in control)
- **-DI > +DI + ADX ≥ 20** → 🔴 BEARISH (sellers in control)
- **+DI ≈ -DI or ADX < 20** → ⚪ NEUTRAL (wait)
Dashboard Info
| Field | Meaning |
|-------|---------|
| STATE | Bullish/Bearish/Neutral + ADX |
| DMI | +DI / -DI values (who's winning) |
| ADX | Trend strength (>20 = trending) |
| RATIO | Volume vs average (SPIKE = unusual) |
| STRENGTH | Visual bar █░░░ (0-100%) |
| ACTION | What to do (BUY/WAIT/SELL) |
Trading Actions
| When | Action |
|------|--------|
| +DI = -DI | ⏸️ WAIT - No direction |
| +DI > -DI + spike | 🟢🔥 STRONG BUY |
| +DI > -DI | 🟢 BUY |
| -DI > +DI + spike | 🔴🔥 STRONG SELL |
| -DI > +DI | 🔴 SELL |
| DMI crossover | 🟢⬆️ BULLISH ENTRY |
| DMI crossunder | 🔴⬇️ EXIT/SHORT |
How to Use
1. Check STATE (bullish/bearish)
2. Check ADX (>20 = strong trend)
3. Follow ACTION suggestion
4. Confirm with price action
Best Timeframes
15min, 30min, 1H, 4H
Alerts (6 types)
- Bullish crossover
- Bearish crossunder
- DMI equal (WAIT signal)
- Volume spike + bullish
- Volume spike + bearish
Limitations
- Lagging indicator (14 periods)
- Does NOT predict future
- False signals in low ADX
Default Settings
- DMI Period: 14
- ADX Threshold: 20
- ADX Filter: ON
- Bar Opacity: 80%
⚠️ Past performance does not guarantee future results. Confirmation with price action required.
What It Does
Colors volume bars GREEN (bullish) or RED (bearish) based on DMI pressure. Shows real-time trading suggestions in dashboard.
How It Works
- **+DI > -DI + ADX ≥ 20** → 🟢 BULLISH (buyers in control)
- **-DI > +DI + ADX ≥ 20** → 🔴 BEARISH (sellers in control)
- **+DI ≈ -DI or ADX < 20** → ⚪ NEUTRAL (wait)
Dashboard Info
| Field | Meaning |
|-------|---------|
| STATE | Bullish/Bearish/Neutral + ADX |
| DMI | +DI / -DI values (who's winning) |
| ADX | Trend strength (>20 = trending) |
| RATIO | Volume vs average (SPIKE = unusual) |
| STRENGTH | Visual bar █░░░ (0-100%) |
| ACTION | What to do (BUY/WAIT/SELL) |
Trading Actions
| When | Action |
|------|--------|
| +DI = -DI | ⏸️ WAIT - No direction |
| +DI > -DI + spike | 🟢🔥 STRONG BUY |
| +DI > -DI | 🟢 BUY |
| -DI > +DI + spike | 🔴🔥 STRONG SELL |
| -DI > +DI | 🔴 SELL |
| DMI crossover | 🟢⬆️ BULLISH ENTRY |
| DMI crossunder | 🔴⬇️ EXIT/SHORT |
How to Use
1. Check STATE (bullish/bearish)
2. Check ADX (>20 = strong trend)
3. Follow ACTION suggestion
4. Confirm with price action
Best Timeframes
15min, 30min, 1H, 4H
Alerts (6 types)
- Bullish crossover
- Bearish crossunder
- DMI equal (WAIT signal)
- Volume spike + bullish
- Volume spike + bearish
Limitations
- Lagging indicator (14 periods)
- Does NOT predict future
- False signals in low ADX
Default Settings
- DMI Period: 14
- ADX Threshold: 20
- ADX Filter: ON
- Bar Opacity: 80%
⚠️ Past performance does not guarantee future results. Confirmation with price action required.

📊 Turning data into clarity
📈 Crypto • Forex • Stocks
💡 Daily setups & indicator strategies
🔔 Join the #IndicatorEdge family
📈 Crypto • Forex • Stocks
💡 Daily setups & indicator strategies
🔔 Join the #IndicatorEdge family
כתב ויתור
המידע והפרסומים אינם מיועדים להיות, ואינם מהווים, ייעוץ או המלצה פיננסית, השקעתית, מסחרית או מכל סוג אחר המסופקת או מאושרת על ידי TradingView. קרא עוד ב־תנאי השימוש.
📊 Turning data into clarity
📈 Crypto • Forex • Stocks
💡 Daily setups & indicator strategies
🔔 Join the #IndicatorEdge family
📈 Crypto • Forex • Stocks
💡 Daily setups & indicator strategies
🔔 Join the #IndicatorEdge family
כתב ויתור
המידע והפרסומים אינם מיועדים להיות, ואינם מהווים, ייעוץ או המלצה פיננסית, השקעתית, מסחרית או מכל סוג אחר המסופקת או מאושרת על ידי TradingView. קרא עוד ב־תנאי השימוש.