מעודכן
Apex Capital 35/12 MA Trend Filter
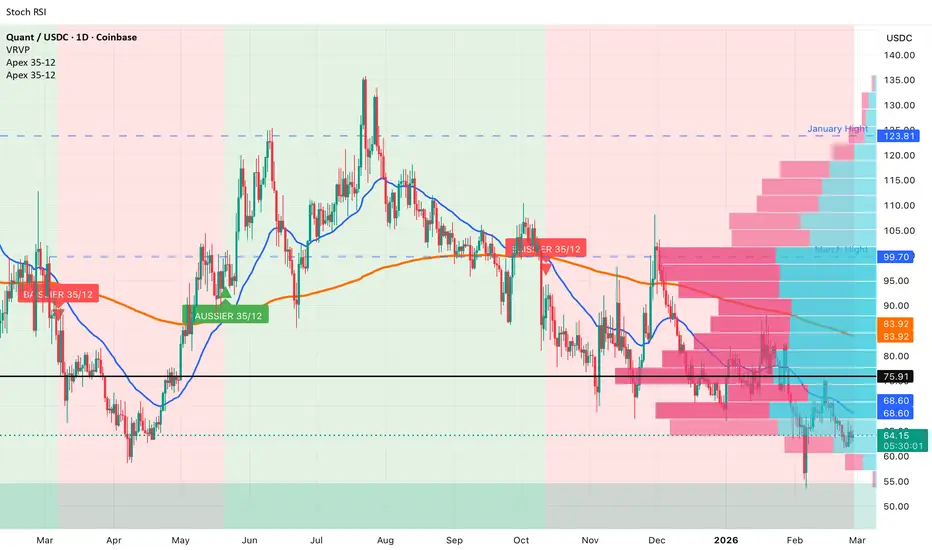
Apex Capital 35/12 MA Trend Filter
This indicator displays a trend filter based on the crossover of two moving averages:
- A short MA (default EMA 35 days) to capture recent price movements.
- A long MA (default SMA/EMA 252 days ≈ 12 months of trading days) to identify the annual trend.
**Main Operation:**
- Green background + bullish signal (triangle ↑) when the 35-day MA crosses above the 252-day MA → confirmed uptrend.
- Red background + bearish signal (triangle ↓) when the 35-day MA crosses below the 252-day MA → confirmed downtrend.
**Features:**
- Choice of MA type (EMA, SMA, WMA, VWMA, RMA).
- Customizable source (close by default).
- Option to display a cloud (fill) between the two moving averages.
- Background coloring for a quick overview of the dominant trend.
- Optional labels at crossover points.
- Built-in alerts for bullish and bearish crossovers.
**Recommended Usage:**
- Timeframe: Daily (or Weekly for a broader view).
- Ideal as a primary trend filter: go long only in green zones, avoid or short in red zones.
- Suitable for stocks, indices, crypto, forex.
**Default parameters optimized for markets with ~252 trading days per year.**
Adjust the periods to match your trading style (e.g., 260 for more precise calendar-based counting).
Happy analyzing!
This indicator displays a trend filter based on the crossover of two moving averages:
- A short MA (default EMA 35 days) to capture recent price movements.
- A long MA (default SMA/EMA 252 days ≈ 12 months of trading days) to identify the annual trend.
**Main Operation:**
- Green background + bullish signal (triangle ↑) when the 35-day MA crosses above the 252-day MA → confirmed uptrend.
- Red background + bearish signal (triangle ↓) when the 35-day MA crosses below the 252-day MA → confirmed downtrend.
**Features:**
- Choice of MA type (EMA, SMA, WMA, VWMA, RMA).
- Customizable source (close by default).
- Option to display a cloud (fill) between the two moving averages.
- Background coloring for a quick overview of the dominant trend.
- Optional labels at crossover points.
- Built-in alerts for bullish and bearish crossovers.
**Recommended Usage:**
- Timeframe: Daily (or Weekly for a broader view).
- Ideal as a primary trend filter: go long only in green zones, avoid or short in red zones.
- Suitable for stocks, indices, crypto, forex.
**Default parameters optimized for markets with ~252 trading days per year.**
Adjust the periods to match your trading style (e.g., 260 for more precise calendar-based counting).
Happy analyzing!
הערות שחרור
Apex Capital 35/12 MA Trend FilterThis indicator plots a short-term 35-day moving average (default EMA) against a long-term ≈12-month (252 trading days) moving average to identify major trend changes via crossovers. Inspired by classic long-term trend filters, it helps spot bullish/bearish regime shifts on daily+ timeframes.
Key Features:
- Customizable MA type: EMA, SMA, WMA, VWMA, or RMA
- Blue line: Short MA (35 periods) — reacts faster to price
- Orange line: Long MA (252 periods) — defines the major trend
- Optional cloud fill between MAs (green/red for bull/bear)
- Background coloring: green for bullish (short > long), red for bearish
- Crossover signals: green up-triangle (bullish cross), red down-triangle (bearish cross)
- Labels on crossovers (toggleable): "HAUSSIER 35/12" or "BAISSIER 35/12"
- Built-in alerts for bullish/bearish crossovers
How to Use:
- Add to daily or higher timeframes for best results (long MA needs ~1 year of data).
- Bullish trend confirmed when blue line crosses above orange → consider long bias.
- Bearish trend when blue crosses below orange → consider short/protective stance.
- Toggle background/cloud/labels in settings for cleaner charts.
- Use crossovers for trend reversal alerts.
Notes:
- Best on stocks/crypto/indices with sufficient history.
- Not a standalone signal — combine with other analysis.
- Mobile-friendly (linewidth optimized).
Feedback welcome! 🚀

כתב ויתור
המידע והפרסומים אינם מיועדים להיות, ואינם מהווים, ייעוץ או המלצה פיננסית, השקעתית, מסחרית או מכל סוג אחר המסופקת או מאושרת על ידי TradingView. קרא עוד ב־תנאי השימוש.
כתב ויתור
המידע והפרסומים אינם מיועדים להיות, ואינם מהווים, ייעוץ או המלצה פיננסית, השקעתית, מסחרית או מכל סוג אחר המסופקת או מאושרת על ידי TradingView. קרא עוד ב־תנאי השימוש.