NAS100 Pullback
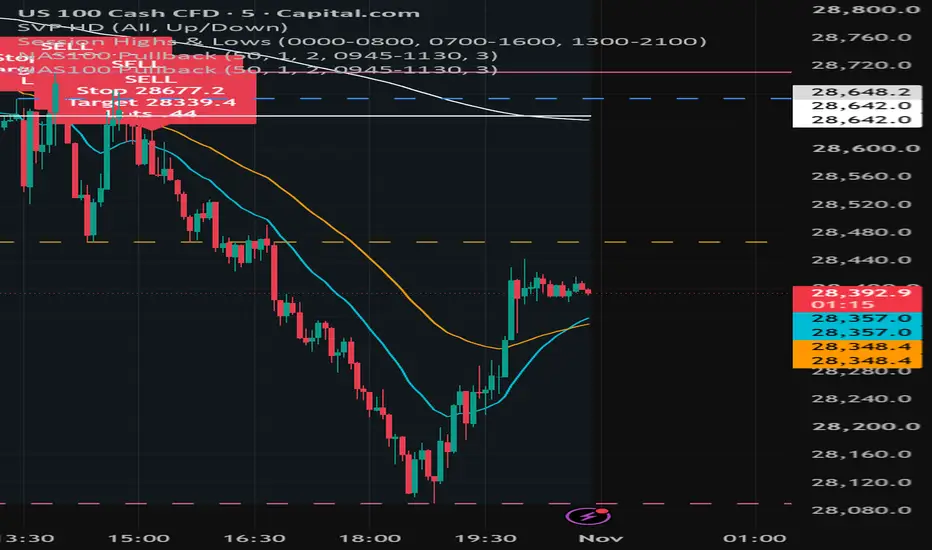
NAS100 Pullback is a trend-following indicator for the 5-minute NAS100 chart. It looks for moments when price dips back to a moving average during a trend, then continues in the trend’s direction.
What it shows: EMA 20 (blue), EMA 50 (orange) and VWAP (white), plus BUY and SELL labels with a suggested stop, target and lot size.
BUY signal: EMA 20 is above EMA 50, price is above VWAP, and a candle dips to the EMA 20 and closes green above it.
SELL signal: EMA 20 is below EMA 50, price is below VWAP, and a candle rises to the EMA 20 and closes red below it.
When it signals: 9:45–11:30 AM New York time, up to 3 signals a day. Signals only appear once the candle has closed.
Stop and target: the stop goes just past the high or low of the last 5 candles, with a small ATR buffer. The target is 2× the stop distance.
Settings: risk per trade ($), dollar value per point for 1 lot, target multiple, trading window and max signals per day. Set the point value to match your broker, or the lot size will be wrong.
Needs volume data: use a CFD feed such as Capital.com or OANDA. Feeds with no volume, like TVC, can’t calculate VWAP, so no signals appear.
This indicator doesn’t guarantee profit. Test it first, and always check the risk in your broker before placing a trade.
What it shows: EMA 20 (blue), EMA 50 (orange) and VWAP (white), plus BUY and SELL labels with a suggested stop, target and lot size.
BUY signal: EMA 20 is above EMA 50, price is above VWAP, and a candle dips to the EMA 20 and closes green above it.
SELL signal: EMA 20 is below EMA 50, price is below VWAP, and a candle rises to the EMA 20 and closes red below it.
When it signals: 9:45–11:30 AM New York time, up to 3 signals a day. Signals only appear once the candle has closed.
Stop and target: the stop goes just past the high or low of the last 5 candles, with a small ATR buffer. The target is 2× the stop distance.
Settings: risk per trade ($), dollar value per point for 1 lot, target multiple, trading window and max signals per day. Set the point value to match your broker, or the lot size will be wrong.
Needs volume data: use a CFD feed such as Capital.com or OANDA. Feeds with no volume, like TVC, can’t calculate VWAP, so no signals appear.
This indicator doesn’t guarantee profit. Test it first, and always check the risk in your broker before placing a trade.

כתב ויתור
המידע והפרסומים אינם מיועדים להיות, ואינם מהווים, ייעוץ או המלצה פיננסית, השקעתית, מסחרית או מכל סוג אחר המסופקת או מאושרת על ידי TradingView. קרא עוד ב־תנאי השימוש.
כתב ויתור
המידע והפרסומים אינם מיועדים להיות, ואינם מהווים, ייעוץ או המלצה פיננסית, השקעתית, מסחרית או מכל סוג אחר המסופקת או מאושרת על ידי TradingView. קרא עוד ב־תנאי השימוש.