PROTECTED SOURCE SCRIPT
xLevTrading MACD - Advanced Momentum & Trend Analyzer
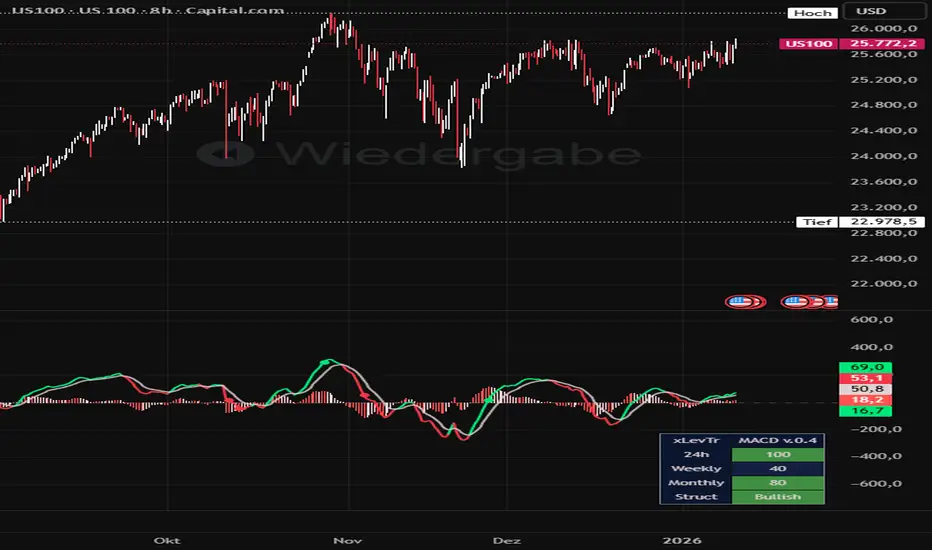
ENGLISH:
The xLevTr MACD is an enhanced version of the classic Moving Average Convergence/Divergence (MACD) indicator. It is designed to combine the traditional MACD momentum analysis with additional visual and analytical tools that help traders identify trends, momentum shifts, and potential extreme conditions more quickly. In addition to displaying the standard MACD line, signal line, and histogram, the indicator integrates an extended analysis concept that includes a momentum scoring system, momentum pivot detection, and an automatic trend color function. This makes the indicator suitable for both short-term momentum analysis and the evaluation of broader market structure.
The traditional MACD measures the difference between two moving averages and visualizes the convergence and divergence of those averages. When the faster average moves above the slower average, it generally indicates increasing bullish momentum. When the faster average falls below the slower average, it signals strengthening bearish momentum. The histogram complements this analysis by displaying the difference between the MACD line and the signal line, helping traders detect changes in momentum and potential trend shifts earlier. The xLevTr MACD builds on this classical structure while adding additional visual and structural insights.
One of the core features of the indicator is an integrated momentum scoring system that evaluates the current market structure on a scale from 0 to 100. Higher values indicate a stronger bullish momentum environment, while lower values suggest bearish momentum. Scores around the midpoint typically represent neutral market conditions or transitional phases between trends. The score is calculated using multiple internal momentum factors and weighted components designed to summarize market conditions efficiently. The result is a compact numerical value that helps traders quickly assess the overall strength of the current market environment without needing to interpret multiple signals simultaneously.
The indicator also identifies exceptionally strong momentum phases. When the algorithm detects unusually strong momentum, small markers appear directly on the MACD line to highlight these events. These momentum pivots represent areas where the market may be experiencing extreme momentum. Such points can sometimes precede momentum slowdowns, consolidations, or potential turning points. To maintain clarity and avoid excessive noise, the indicator only marks statistically significant momentum extremes rather than every local high or low.
Another key feature is the Auto Color function, which automatically colors the MACD line based on the current momentum and trend structure. Bullish conditions are highlighted with positive trend colors, while bearish conditions appear in negative trend colors. This visual feedback allows traders to recognize trend shifts and momentum changes immediately without closely inspecting individual values. If the Auto Color function is disabled, the indicator allows full manual color customization.
In addition to the visual analysis within the MACD pane, the indicator includes a Multi-Timeframe Score Table. This table displays the momentum score for multiple selectable timeframes simultaneously, providing a quick overview of how market momentum behaves across different time horizons. By comparing scores across timeframes, traders can determine whether momentum aligns across the market structure or whether the market is currently transitioning between trend phases.
The xLevTr MACD combines the reliability of the classic MACD with modern visualization and evaluation methods. By integrating momentum scoring, pivot detection, automatic trend coloring, and multi-timeframe analysis, the indicator provides a structured and intuitive way to interpret market trends and momentum dynamics.
The xLevTr MACD is an enhanced version of the classic Moving Average Convergence/Divergence (MACD) indicator. It is designed to combine the traditional MACD momentum analysis with additional visual and analytical tools that help traders identify trends, momentum shifts, and potential extreme conditions more quickly. In addition to displaying the standard MACD line, signal line, and histogram, the indicator integrates an extended analysis concept that includes a momentum scoring system, momentum pivot detection, and an automatic trend color function. This makes the indicator suitable for both short-term momentum analysis and the evaluation of broader market structure.
The traditional MACD measures the difference between two moving averages and visualizes the convergence and divergence of those averages. When the faster average moves above the slower average, it generally indicates increasing bullish momentum. When the faster average falls below the slower average, it signals strengthening bearish momentum. The histogram complements this analysis by displaying the difference between the MACD line and the signal line, helping traders detect changes in momentum and potential trend shifts earlier. The xLevTr MACD builds on this classical structure while adding additional visual and structural insights.
One of the core features of the indicator is an integrated momentum scoring system that evaluates the current market structure on a scale from 0 to 100. Higher values indicate a stronger bullish momentum environment, while lower values suggest bearish momentum. Scores around the midpoint typically represent neutral market conditions or transitional phases between trends. The score is calculated using multiple internal momentum factors and weighted components designed to summarize market conditions efficiently. The result is a compact numerical value that helps traders quickly assess the overall strength of the current market environment without needing to interpret multiple signals simultaneously.
The indicator also identifies exceptionally strong momentum phases. When the algorithm detects unusually strong momentum, small markers appear directly on the MACD line to highlight these events. These momentum pivots represent areas where the market may be experiencing extreme momentum. Such points can sometimes precede momentum slowdowns, consolidations, or potential turning points. To maintain clarity and avoid excessive noise, the indicator only marks statistically significant momentum extremes rather than every local high or low.
Another key feature is the Auto Color function, which automatically colors the MACD line based on the current momentum and trend structure. Bullish conditions are highlighted with positive trend colors, while bearish conditions appear in negative trend colors. This visual feedback allows traders to recognize trend shifts and momentum changes immediately without closely inspecting individual values. If the Auto Color function is disabled, the indicator allows full manual color customization.
In addition to the visual analysis within the MACD pane, the indicator includes a Multi-Timeframe Score Table. This table displays the momentum score for multiple selectable timeframes simultaneously, providing a quick overview of how market momentum behaves across different time horizons. By comparing scores across timeframes, traders can determine whether momentum aligns across the market structure or whether the market is currently transitioning between trend phases.
The xLevTr MACD combines the reliability of the classic MACD with modern visualization and evaluation methods. By integrating momentum scoring, pivot detection, automatic trend coloring, and multi-timeframe analysis, the indicator provides a structured and intuitive way to interpret market trends and momentum dynamics.
סקריפט מוגן
סקריפט זה פורסם כמקור סגור. עם זאת, תוכל להשתמש בו בחופשיות וללא כל מגבלות – למד עוד כאן

כתב ויתור
המידע והפרסומים אינם מיועדים להיות, ואינם מהווים, ייעוץ או המלצה פיננסית, השקעתית, מסחרית או מכל סוג אחר המסופקת או מאושרת על ידי TradingView. קרא עוד ב־תנאי השימוש.
סקריפט מוגן
סקריפט זה פורסם כמקור סגור. עם זאת, תוכל להשתמש בו בחופשיות וללא כל מגבלות – למד עוד כאן
כתב ויתור
המידע והפרסומים אינם מיועדים להיות, ואינם מהווים, ייעוץ או המלצה פיננסית, השקעתית, מסחרית או מכל סוג אחר המסופקת או מאושרת על ידי TradingView. קרא עוד ב־תנאי השימוש.