OPEN-SOURCE SCRIPT
מעודכן Volatility Bands Using t-Distribution & Prediction Intervals
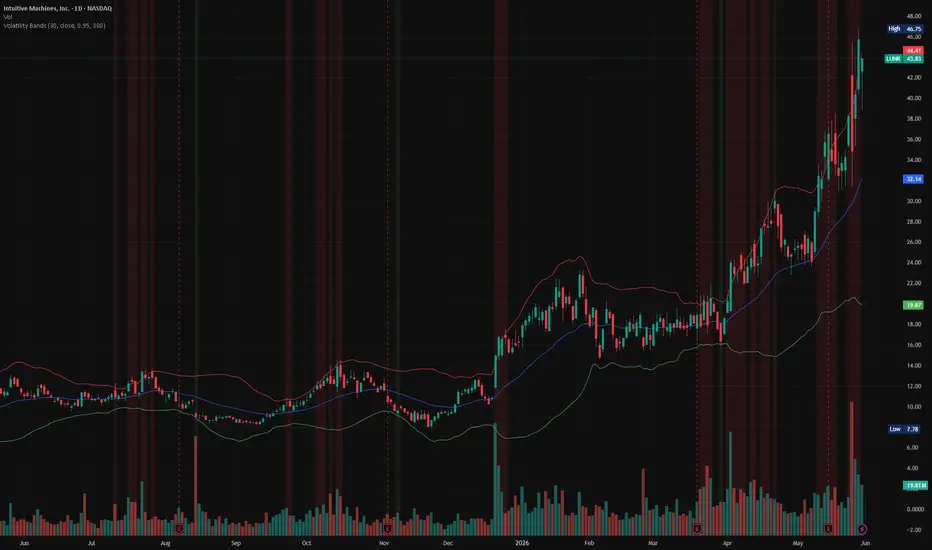
This indicator is a statistical tool designed to project a dynamic range where the next asset price is expected to fall within a specific level of confidence.
Unlike standard volatility bands, a prediction interval is a statistical range that estimates where a single future observation will fall, given a specific probability. Because predicting a single future outcome introduces more inherent uncertainty than predicting an average, these bands are wider and mathematically tighter for forecasting next-bar anomalies.
How it Works
This indicator uses a Student's t-distribution (or an optional z-distribution for performance) to calculate historical volatility thresholds.
Finding the Estimated t-distribution
When you select a 95% Confidence Level, the script sets an error alpha of 5% (1 - 0.95). Because asset price movement can deviate to either the upside or downside, it splits this error equally into both tails (a two-tailed test). The script normalizes this, targeting an exact area of 0.025 (2.5%) in the extreme tails of the curve.
To find where that target area lies, the script reconstructs the Probability Density Function (PDF) of the Student's t-distribution. The height of the curve depends heavily on the Degrees of Freedom (df = length - 1).
Because Pine Script doesn't have a native Gamma function, the script uses double factorials to calculate the complex math coefficients. If your sample size (length) is exceptionally high (>300), the t-distribution naturally mirrors a regular normal distribution, so it switches to a standard Gaussian curve equation to save some time.
Pine Script®
To find the approximate t-value that corresponds to our target tail area, the script performs numerical integration using the Trapezoid Rule (trapezoid_reverse). This is the most time consuming part.
Pine Script®
Calculating the Prediction Interval
Once the t-critical value is found, it is then put into the standard prediction interval formula. The script uses EMA instead of SMA to improve responsiveness to current trends.
Pine Script®
Because the calculations for the t-distribution estimates are computationally expensive, you can select the lookback window for using the t-distribution. You can also choose to use the faster z-score for historical bars.
Note 1: The larger the sample size, the smaller you may have to set your lookback window in order to fit within the execution time limits.
You can use this for:
1. Overbought/Oversold/Mean Reversion

The indicator creates a red background to indicate that the candlestick has broken above the top 95% prediction interval band. It can be interpreted as a potential reversal.
2. Dynamic Stop-loss/Take-profit (SL/TP)
You can utilize the plotted mean and the confidence interval as entry/exit points. For example, you could put a stop-loss at the bottom band, and a take profit at the top band.
Alerts:
Settings:
Background Colors:
Limitations:
Disclaimer: All trading decisions and responsibilities rest solely on the user of the indicator.
Unlike standard volatility bands, a prediction interval is a statistical range that estimates where a single future observation will fall, given a specific probability. Because predicting a single future outcome introduces more inherent uncertainty than predicting an average, these bands are wider and mathematically tighter for forecasting next-bar anomalies.
How it Works
This indicator uses a Student's t-distribution (or an optional z-distribution for performance) to calculate historical volatility thresholds.
Finding the Estimated t-distribution
When you select a 95% Confidence Level, the script sets an error alpha of 5% (1 - 0.95). Because asset price movement can deviate to either the upside or downside, it splits this error equally into both tails (a two-tailed test). The script normalizes this, targeting an exact area of 0.025 (2.5%) in the extreme tails of the curve.
To find where that target area lies, the script reconstructs the Probability Density Function (PDF) of the Student's t-distribution. The height of the curve depends heavily on the Degrees of Freedom (df = length - 1).
Because Pine Script doesn't have a native Gamma function, the script uses double factorials to calculate the complex math coefficients. If your sample size (length) is exceptionally high (>300), the t-distribution naturally mirrors a regular normal distribution, so it switches to a standard Gaussian curve equation to save some time.
To find the approximate t-value that corresponds to our target tail area, the script performs numerical integration using the Trapezoid Rule (trapezoid_reverse). This is the most time consuming part.
Calculating the Prediction Interval
Once the t-critical value is found, it is then put into the standard prediction interval formula. The script uses EMA instead of SMA to improve responsiveness to current trends.
Because the calculations for the t-distribution estimates are computationally expensive, you can select the lookback window for using the t-distribution. You can also choose to use the faster z-score for historical bars.
Note 1: The larger the sample size, the smaller you may have to set your lookback window in order to fit within the execution time limits.
You can use this for:
- Overbought/Oversold, Mean reversion signals
- Dynamic Stop-loss/Take-profit (SL/TP)
1. Overbought/Oversold/Mean Reversion
The indicator creates a red background to indicate that the candlestick has broken above the top 95% prediction interval band. It can be interpreted as a potential reversal.
2. Dynamic Stop-loss/Take-profit (SL/TP)
You can utilize the plotted mean and the confidence interval as entry/exit points. For example, you could put a stop-loss at the bottom band, and a take profit at the top band.
Alerts:
- Price Above Top PI (Close crossed out)
- Price Below Bottom PI (Close crossed out)
- High Above Top PI (Wick touched/pierced top)
- Low Below Bottom PI (Wick touched/pierced bottom)
Settings:
- Length: The size of the sample for the standard deviation & mean calculations. 30 is recommended.
- Source: Used for standard deviation & mean calculations. For example: Changing the source to 'high' would make the indicator predict the range of the next 'high'.
- Confidence Level: Dictates how wide the bands should be. A 95% confidence level is default. Must be entered as a decimal between 0 and 1.
- Lookback Length: Used to limit the amount of bars to back calculate the prediction interval using the t-distribution. Default is 300.
- Use z-score: Use the z-score to calculated past values. Note that this will introduce error. For example, for a sample size of 30 and a 95% confidence level, using a z-score instead of a t-score will introduce a ~4.2% error in your interval width, causing your actual prediction interval to drop from 95% down to ~94.0%.
Background Colors:
- Green: The low/close of the candle breached the lower band. Potential bullish reversal.
- Red: The high/close of the candle breached the upper band. Potential bearish reversal.
Limitations:
- The indicator assumes that the data follows a bell curve, which the markets do not.
- The indicator may lag behind actual price action.
- The indicator may produce false signals.
- The indicator does not predict future prices.
Disclaimer: All trading decisions and responsibilities rest solely on the user of the indicator.
הערות שחרור
Removed lookback length/useZ settings, replaced with one-time t-value calculation for all.הערות שחרור
Removed the z-score calculation since that's not needed anymore.סקריפט קוד פתוח
ברוח האמיתית של TradingView, יוצר הסקריפט הזה הפך אותו לקוד פתוח, כך שסוחרים יוכלו לעיין בו ולאמת את פעולתו. כל הכבוד למחבר! אמנם ניתן להשתמש בו בחינם, אך זכור כי פרסום חוזר של הקוד כפוף ל־כללי הבית שלנו.

כתב ויתור
המידע והפרסומים אינם מיועדים להיות, ואינם מהווים, ייעוץ או המלצה פיננסית, השקעתית, מסחרית או מכל סוג אחר המסופקת או מאושרת על ידי TradingView. קרא עוד ב־תנאי השימוש.
סקריפט קוד פתוח
ברוח האמיתית של TradingView, יוצר הסקריפט הזה הפך אותו לקוד פתוח, כך שסוחרים יוכלו לעיין בו ולאמת את פעולתו. כל הכבוד למחבר! אמנם ניתן להשתמש בו בחינם, אך זכור כי פרסום חוזר של הקוד כפוף ל־כללי הבית שלנו.
כתב ויתור
המידע והפרסומים אינם מיועדים להיות, ואינם מהווים, ייעוץ או המלצה פיננסית, השקעתית, מסחרית או מכל סוג אחר המסופקת או מאושרת על ידי TradingView. קרא עוד ב־תנאי השימוש.