CVD Pro
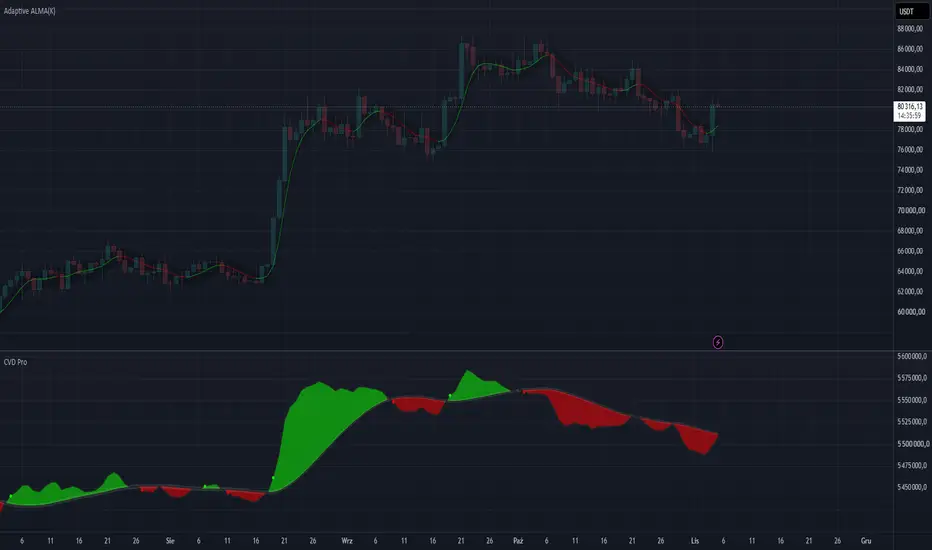
CVD Pro is an statistical volume analytics tool for TradingView. Traditional Cumulative Volume Delta (CVD) indicators simply add volume on green candles and subtract it on red candles, leading to massive inaccuracies.
This script solves that problem by using mathematical models to estimate the true balance of aggressive buyers and sellers (Order Flow), making it highly effective even on markets without decentralized tape data (like Forex or CFD indices).
Here is a breakdown of its core mechanics:
• Probabilistic Volume Decomposition (BVC): Instead of assigning 100% of a candle's volume to one side, it uses a Cumulative Distribution Function (normCDF) to split volume proportionally (e.g., 65% buying, 35% selling) based on price position and velocity.
• Garman-Klass / Yang-Zhang Volatility: It dynamically measures market volatility by calculating overnight gaps, intraday ranges, and candle body sizes to establish an adaptive baseline.
• Wyckoff Anomaly Detection (Mahalanobis Distance): The script measures the statistical relationship between "Effort" (Volume) and "Result" (Candle Spread). If a massive volume injection results in a tiny candle move, the script automatically detects passive absorption (a major player absorbing orders) and dockets this hidden pressure into the CVD line.
• The Evasion Zone (Noise Filter): It builds an adaptive standard deviation band around the moving average. When the market consolidates sideways, the CVD line "freezes" to the MA, eliminating roughly 80% of choppy, false breakout signals.
How to Use CVD Pro (Trading Instructions)
To get the most out of this indicator, load it into a sub-panel below your price chart. It is optimized for Day Trading and Scalping (1-minute to 30-minute charts).
1. Trading the Crossover Dots (Filtered Signals)
The script automatically prints colored dots based on market extremes and sequence memory:
• Teal Dot (Bullish Signal): Appears when the CVD line dynamically breaks above the upper gray band after a verified period of seller exhaustion. Look for long entries.
• Red Dot (Bearish Signal): Appears when the CVD line breaks below the lower gray band after a verified period of buyer exhaustion. Look for short entries.
Crucial Rule: Always wait for the candle to fully close before taking a trade, as the indicator recalculates mid-candle.
2. Spotting Volume Divergences
Divergences between the price action and the CVD Pro line provide the highest-probability setups:
• Bearish Divergence: Price prints a higher high, but the CVD Pro line prints a lower high (or remains flat). This means the price increase is artificial, driven by a lack of selling pressure rather than aggressive buying. Prepare for a reversal downwards.
• Bullish Divergence: Price prints a lower low, but the CVD Pro line prints a higher low. Aggressive sellers are gone, and passive buyers are taking over. Prepare for a reversal upwards.
3. Identifying Institutional Absorption
Watch the gray Evasion Zone during high-impact news or key support/resistance tests:
• If volume spikes aggressively but the CVD line remains trapped inside the gray zone (or stays flat), you are witnessing institutional absorption. The market is hitting an "invisible wall" of limit orders, and a sharp bounce in the opposite direction is highly likely.
This script solves that problem by using mathematical models to estimate the true balance of aggressive buyers and sellers (Order Flow), making it highly effective even on markets without decentralized tape data (like Forex or CFD indices).
Here is a breakdown of its core mechanics:
• Probabilistic Volume Decomposition (BVC): Instead of assigning 100% of a candle's volume to one side, it uses a Cumulative Distribution Function (normCDF) to split volume proportionally (e.g., 65% buying, 35% selling) based on price position and velocity.
• Garman-Klass / Yang-Zhang Volatility: It dynamically measures market volatility by calculating overnight gaps, intraday ranges, and candle body sizes to establish an adaptive baseline.
• Wyckoff Anomaly Detection (Mahalanobis Distance): The script measures the statistical relationship between "Effort" (Volume) and "Result" (Candle Spread). If a massive volume injection results in a tiny candle move, the script automatically detects passive absorption (a major player absorbing orders) and dockets this hidden pressure into the CVD line.
• The Evasion Zone (Noise Filter): It builds an adaptive standard deviation band around the moving average. When the market consolidates sideways, the CVD line "freezes" to the MA, eliminating roughly 80% of choppy, false breakout signals.
How to Use CVD Pro (Trading Instructions)
To get the most out of this indicator, load it into a sub-panel below your price chart. It is optimized for Day Trading and Scalping (1-minute to 30-minute charts).
1. Trading the Crossover Dots (Filtered Signals)
The script automatically prints colored dots based on market extremes and sequence memory:
• Teal Dot (Bullish Signal): Appears when the CVD line dynamically breaks above the upper gray band after a verified period of seller exhaustion. Look for long entries.
• Red Dot (Bearish Signal): Appears when the CVD line breaks below the lower gray band after a verified period of buyer exhaustion. Look for short entries.
Crucial Rule: Always wait for the candle to fully close before taking a trade, as the indicator recalculates mid-candle.
2. Spotting Volume Divergences
Divergences between the price action and the CVD Pro line provide the highest-probability setups:
• Bearish Divergence: Price prints a higher high, but the CVD Pro line prints a lower high (or remains flat). This means the price increase is artificial, driven by a lack of selling pressure rather than aggressive buying. Prepare for a reversal downwards.
• Bullish Divergence: Price prints a lower low, but the CVD Pro line prints a higher low. Aggressive sellers are gone, and passive buyers are taking over. Prepare for a reversal upwards.
3. Identifying Institutional Absorption
Watch the gray Evasion Zone during high-impact news or key support/resistance tests:
• If volume spikes aggressively but the CVD line remains trapped inside the gray zone (or stays flat), you are witnessing institutional absorption. The market is hitting an "invisible wall" of limit orders, and a sharp bounce in the opposite direction is highly likely.

כתב ויתור
המידע והפרסומים אינם מיועדים להיות, ואינם מהווים, ייעוץ או המלצה פיננסית, השקעתית, מסחרית או מכל סוג אחר המסופקת או מאושרת על ידי TradingView. קרא עוד ב־תנאי השימוש.
כתב ויתור
המידע והפרסומים אינם מיועדים להיות, ואינם מהווים, ייעוץ או המלצה פיננסית, השקעתית, מסחרית או מכל סוג אחר המסופקת או מאושרת על ידי TradingView. קרא עוד ב־תנאי השימוש.