מעודכן
Swing Points by MATA
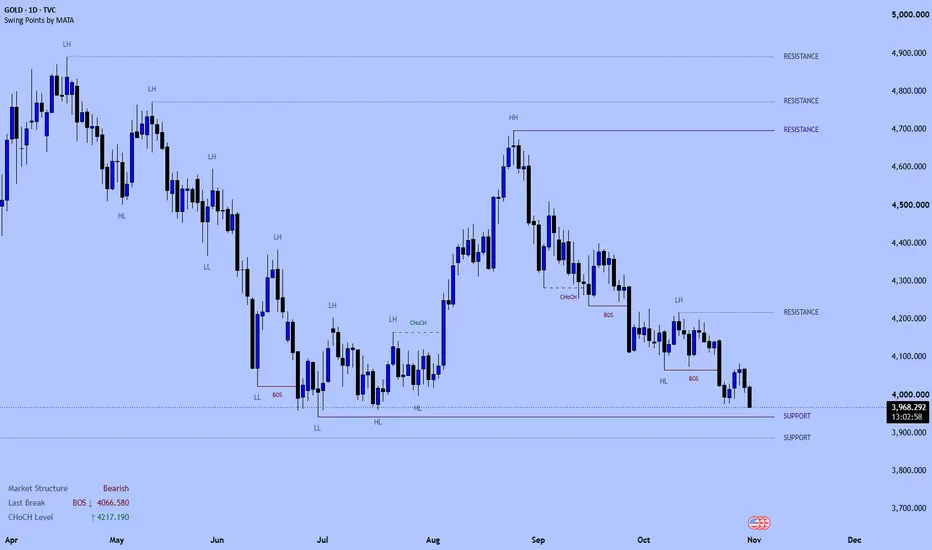
Swing Points by MATA
HH · HL · LH · LL with swing support and resistance
Swing Points by MATA is an original indicator, written from scratch, that labels every confirmed swing in the market and turns the latest swings into clean support and resistance levels. It gives a quick, objective read of market structure on any instrument and timeframe: forex, gold, indices, crypto and more.
1. SWING LABELS
• HH (Higher High): a swing high above the previous swing high.
• LH (Lower High): a swing high below the previous swing high.
• HL (Higher Low): a swing low above the previous swing low.
• LL (Lower Low): a swing low below the previous swing low.
• A swing is confirmed after a set number of candles on each side (Swing Strength). Once printed, a label never moves or disappears.
• Highs and lows always alternate: if two highs form in a row, only the higher one is kept (two lows in a row: only the lower one), so labels never double up.
2. SWING SUPPORT / RESISTANCE
• RESISTANCE at the latest swing highs, SUPPORT at the latest swing lows.
• Each level extends to the right until a candle CLOSES through it, then it is removed. A wick through the level does not remove it.
• Shows the latest levels on each side (3 by default), so the chart stays clean.
3. TREND PANEL
• Uptrend: last high is HH and last low is HL.
• Downtrend: last high is LH and last low is LL.
• Range: mixed signals.
• Also shows the latest high and low with their labels and prices.
ALERTS
New HH, New HL, New LH, New LL, Resistance Broken (close above), Support Broken (close below).
SETTINGS
• Swing Strength: lower values show more minor swings, higher values show only major swings.
• Each label (HH, HL, LH, LL) can be turned on or off, with optional price display.
• Support / resistance: number of levels, line style, width, color and label.
• Colors, text size and panel position.
HOW TO USE (example)
• Trend: a series of HH + HL means buyers are in control; LH + LL means sellers are in control.
• Continuation: in an uptrend, a close above RESISTANCE after a new HL confirms the next leg up (the opposite for downtrends).
• Possible reversal: in an uptrend, the first LH followed by a close below SUPPORT is an early warning that the trend may be changing.
• Always combine with your own confirmation and risk management.
NOTES
• Labels appear only after the swing is confirmed (Swing Strength candles later). This delay is what makes them non-repainting.
• Default colors are black, designed for light or grey chart backgrounds. On a dark background, change the colors in Settings.
DISCLAIMER
This indicator is an analysis tool, not a signal service or financial advice. Past structure does not guarantee future price behavior. Always use proper risk management and test any approach on a demo account first.
HH · HL · LH · LL with swing support and resistance
Swing Points by MATA is an original indicator, written from scratch, that labels every confirmed swing in the market and turns the latest swings into clean support and resistance levels. It gives a quick, objective read of market structure on any instrument and timeframe: forex, gold, indices, crypto and more.
1. SWING LABELS
• HH (Higher High): a swing high above the previous swing high.
• LH (Lower High): a swing high below the previous swing high.
• HL (Higher Low): a swing low above the previous swing low.
• LL (Lower Low): a swing low below the previous swing low.
• A swing is confirmed after a set number of candles on each side (Swing Strength). Once printed, a label never moves or disappears.
• Highs and lows always alternate: if two highs form in a row, only the higher one is kept (two lows in a row: only the lower one), so labels never double up.
2. SWING SUPPORT / RESISTANCE
• RESISTANCE at the latest swing highs, SUPPORT at the latest swing lows.
• Each level extends to the right until a candle CLOSES through it, then it is removed. A wick through the level does not remove it.
• Shows the latest levels on each side (3 by default), so the chart stays clean.
3. TREND PANEL
• Uptrend: last high is HH and last low is HL.
• Downtrend: last high is LH and last low is LL.
• Range: mixed signals.
• Also shows the latest high and low with their labels and prices.
ALERTS
New HH, New HL, New LH, New LL, Resistance Broken (close above), Support Broken (close below).
SETTINGS
• Swing Strength: lower values show more minor swings, higher values show only major swings.
• Each label (HH, HL, LH, LL) can be turned on or off, with optional price display.
• Support / resistance: number of levels, line style, width, color and label.
• Colors, text size and panel position.
HOW TO USE (example)
• Trend: a series of HH + HL means buyers are in control; LH + LL means sellers are in control.
• Continuation: in an uptrend, a close above RESISTANCE after a new HL confirms the next leg up (the opposite for downtrends).
• Possible reversal: in an uptrend, the first LH followed by a close below SUPPORT is an early warning that the trend may be changing.
• Always combine with your own confirmation and risk management.
NOTES
• Labels appear only after the swing is confirmed (Swing Strength candles later). This delay is what makes them non-repainting.
• Default colors are black, designed for light or grey chart backgrounds. On a dark background, change the colors in Settings.
DISCLAIMER
This indicator is an analysis tool, not a signal service or financial advice. Past structure does not guarantee future price behavior. Always use proper risk management and test any approach on a demo account first.
הערות שחרור
Swing Points by MATAHH · HL · LH · LL with minor and major support / resistance
Swing Points by MATA is an original indicator, written from scratch, that labels every confirmed swing in the market and turns the swings into clean support and resistance levels. It shows the structure the way a price-action trader reads it: where the market made its highs and lows, which levels are minor, which levels are major, and which broken levels have flipped. It works on any instrument and timeframe: forex, gold, indices, crypto and more.
SWING LABELS
A swing high or low is confirmed once a set number of candles has formed on each side of it (Swing Strength), and after that it never moves or disappears. Every swing high is compared with the previous swing high (HH or LH) and every swing low with the previous swing low (HL or LL). Highs and lows always alternate: if two highs form in a row, only the higher one is kept, and if two lows form in a row, only the lower one is kept, so the labels never double up. HH with HL describes an uptrend, LH with LL describes a downtrend.
MINOR SUPPORT AND RESISTANCE
The latest swing highs become resistance and the latest swing lows become support, drawn as dotted lines that end just to the right of the last candle with their name next to them. A level stays on the chart until a candle closes through it; a wick through the level does not remove it.
MAJOR SUPPORT AND RESISTANCE
Major levels come from the market structure itself. Major resistance sits on the highest HH of each bullish structure, and major support sits on the lowest LL of each bearish structure. While a structure is still running, its major level follows each new HH or LL. When the structure ends (an LH or LL after the higher highs, an HL or HH after the lower lows), the level is locked in place. Major levels are drawn as solid lines, and a minor level is never drawn on top of a major level at the same price.
FLIPPED LEVELS (R→S / S→R)
When a candle closes through a locked major level, the level is not deleted. Broken resistance becomes support (R→S) and broken support becomes resistance (S→R), drawn as a dashed amber line, until price closes back through it. These role-reversal levels are often where price returns to retest before continuing.
TREND PANEL
A small panel shows the current swing structure (uptrend, downtrend or range) and the latest high and low with their labels and prices.
HOW TO USE
Read the trend from the labels, mark the major levels as the key areas, and use the minor levels for entries and targets inside the structure. A retest of an R→S level in an uptrend, or an S→R level in a downtrend, is a classic area to look for a setup. Always wait for your own confirmation, place the stop beyond the level, and target the next opposite level. No confirmation, no trade.
NOTES
Labels appear only after the swing is confirmed (Swing Strength candles later); this delay is what makes them non-repainting. The latest major level can still move while its structure is running and is locked when the structure ends. All colors, line styles, widths, the number of levels and the text size can be changed in the settings.
DISCLAIMER
This indicator is for analysis and education only and is not financial advice. Always use proper risk management.
הערות שחרור
Swing Points by MATAHH · HL · LH · LL with minor and major support / resistance
Swing Points by MATA is an original indicator, written from scratch, that labels every confirmed swing in the market and turns the swings into clean support and resistance levels. It shows the structure the way a price-action trader reads it: where the market made its highs and lows, which levels are minor, which levels are major, and which broken levels have flipped. It works on any instrument and timeframe: forex, gold, indices, crypto and more.
SWING LABELS
A swing high or low is confirmed once a set number of candles has formed on each side of it (Swing Strength), and after that it never moves or disappears. Every swing high is compared with the previous swing high (HH or LH) and every swing low with the previous swing low (HL or LL). Highs and lows always alternate: if two highs form in a row, only the higher one is kept, and if two lows form in a row, only the lower one is kept, so the labels never double up. HH with HL describes an uptrend, LH with LL describes a downtrend.
MINOR SUPPORT AND RESISTANCE
The latest swing highs become resistance and the latest swing lows become support, drawn as thin dotted lines that end just to the right of the last candle, with RESISTANCE or SUPPORT written next to them. A level stays on the chart until a candle closes through it; a wick through the level does not remove it.
MAJOR SUPPORT AND RESISTANCE
Major levels come from the market structure itself. Major resistance sits on the highest HH of each bullish structure, and major support sits on the lowest LL of each bearish structure. While a structure is still running, its major level follows each new HH or LL. When the structure ends (an LH or LL after the higher highs, an HL or HH after the lower lows), the level is locked in place. Major levels carry the same RESISTANCE / SUPPORT text but are drawn as a solid line in a different color, so minor and major levels are told apart by their line alone. A minor level is never drawn on top of a major level from the same swing.
FLIPPED LEVELS (R→S / S→R)
When a candle closes through a locked major level, the level is not deleted. Broken resistance becomes support (R→S) and broken support becomes resistance (S→R), drawn as a dashed line, until price closes back through it. These role-reversal levels are often where price returns to retest before continuing.
TREND PANEL
A small panel shows the current swing structure (uptrend, downtrend or range) and the latest high and low with their labels and prices.
HOW TO USE
Read the trend from the labels, mark the major levels (solid lines) as the key areas, and use the minor levels for entries and targets inside the structure. A retest of an R→S level in an uptrend, or an S→R level in a downtrend, is a classic area to look for a setup. Always wait for your own confirmation, place the stop beyond the level, and target the next opposite level. No confirmation, no trade.
NOTES
Labels appear only after the swing is confirmed (Swing Strength candles later); this delay is what makes them non-repainting. The latest major level can still move while its structure is running and is locked when the structure ends. The default colors are dark tones made for silver or light chart backgrounds; all colors, line styles, widths, the number of levels and the text size can be changed in the settings.
DISCLAIMER
This indicator is for analysis and education only and is not financial advice. Always use proper risk management.
הערות שחרור
Swing Points by MATAHH, HL, LH, LL, BOS / CHoCH and swing support / resistance: clean market structure on any chart.
Swing Points by MATA is an original indicator that labels every confirmed swing, reads the market structure from candle closes and draws the support and resistance levels that still hold. It works on any symbol and any timeframe.
SWING POINTS
- A swing high / low is confirmed when it has N lower highs / higher lows on each side (5 by default). It appears after those N candles have closed and then never moves.
- Highs and lows always alternate: two highs in a row keep only the higher one, two lows in a row keep only the lower one, so labels never double up.
- Every high is compared with the previous high (HH = higher high, LH = lower high), every low with the previous low (HL = higher low, LL = lower low).
MARKET STRUCTURE
- BOS (solid line): a candle CLOSES beyond the last confirmed swing in the direction of the trend, so the trend continues.
- CHoCH (dashed line): the first candle CLOSE beyond the last confirmed swing against the trend: the first sign of a change in direction.
- A wick through a swing is not a break. Each swing can be broken only once. Green is bullish, burgundy is bearish. Only the most recent breaks are kept on the chart (5 by default).
SUPPORT / RESISTANCE
- RESISTANCE / SUPPORT (dotted): levels from the swing highs and lows. A level stays until a candle CLOSES through it.
- Major RESISTANCE / SUPPORT (solid): the highest HH of a bullish structure and the lowest LL of a bearish structure. While the structure runs the level follows each new HH / LL; it is fixed when the structure ends.
- R→S / S→R (dashed): a broken major level is not deleted. Broken resistance becomes support (R→S), broken support becomes resistance (S→R), until price closes back through it.
- Every unbroken level is tracked, however old it is, and only the levels NEAREST to price are drawn (5 swing levels and 3 major levels each side by default). An old level that still holds therefore appears again when price comes back to it, and the chart stays clean.
PANEL (bottom left)
- Market Structure: Bullish or Bearish, from the last BOS / CHoCH.
- Last Break: the last BOS / CHoCH, its direction and its price.
- CHoCH Level: the price a candle has to close beyond to change the structure (the last swing high in a bearish structure, the last swing low in a bullish one).
ALERTS
Bullish / Bearish BOS, Bullish / Bearish CHoCH, New HH, New LH, New HL, New LL.
REPAINTING
Swings, labels, BOS / CHoCH and support / resistance breaks are confirmed on closed candles and do not repaint. A swing appears only after its right-side confirmation candles have closed; this delay is part of the design. While a bullish or bearish structure is still running, its major level moves to each new HH / LL. Which levels are drawn (the nearest to price) is updated with every candle.
HOW TO USE
1. Read the panel: trade in the direction of the Market Structure, and watch the CHoCH Level as the price that would invalidate it.
2. Use the nearest RESISTANCE / S→R above price and SUPPORT / R→S below price as reaction zones and targets.
3. Treat a CHoCH as a warning and a BOS as confirmation. Wait for a candle close, not a wick.
4. Place the stop beyond the swing that protects your idea, not exactly on it.
SETTINGS
Swing strength, label types and size, price on labels, number of levels, line styles, colors, BOS / CHoCH on or off, number of breaks shown, panel position.
DISCLAIMER
This indicator is for education and analysis only and is not financial advice. Market structure describes what price has done; it does not predict what price will do. Always use proper risk management.

כתב ויתור
המידע והפרסומים אינם מיועדים להיות, ואינם מהווים, ייעוץ או המלצה פיננסית, השקעתית, מסחרית או מכל סוג אחר המסופקת או מאושרת על ידי TradingView. קרא עוד ב־תנאי השימוש.
כתב ויתור
המידע והפרסומים אינם מיועדים להיות, ואינם מהווים, ייעוץ או המלצה פיננסית, השקעתית, מסחרית או מכל סוג אחר המסופקת או מאושרת על ידי TradingView. קרא עוד ב־תנאי השימוש.