KIRON Flow
OVERVIEW
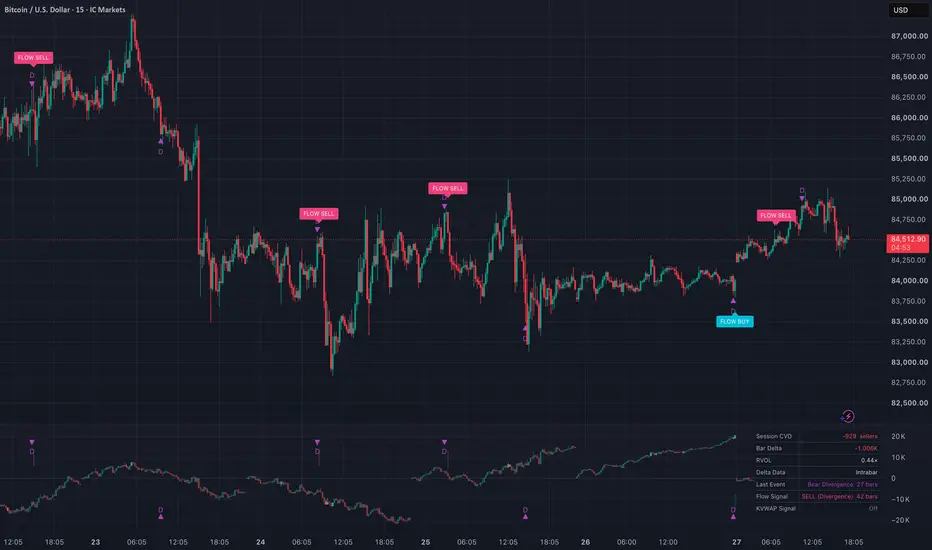
KIRON Flow is an order-flow confirmation indicator that estimates buying and selling aggression from intrabar data and evaluates it against session VWAP structure. It plots session Cumulative Volume Delta (CVD) as candles, detects absorption and CVD divergence at key VWAP levels, prints its own two-stage reversal signals, and can grade signals from its companion indicator, KIRON VWAP Engine, as confirmed or unconfirmed by order flow.
The two indicators are designed to answer different questions. KIRON VWAP Engine shows where price is relative to volume-weighted fair value and when a structured setup has formed. KIRON Flow shows whether aggressive participation supports that setup. Each works on its own; used together, they separate setups that have order-flow support from those that do not.
HOW IT WORKS
1. Intrabar Delta Estimation
TradingView does not provide bid/ask trade data, so delta is estimated from lower-timeframe bars (1-minute by default). For each intrabar, volume is split between buyers and sellers using one of two methods:
- Close Location (default): delta = volume x (2 x close - high - low) / (high - low). An intrabar closing at its high counts as fully buyer-initiated, at its low fully seller-initiated, and proportionally in between.
- Up/Down Bar: all of an intrabar's volume is assigned by its direction.
Intrabars with no range fall back to a tick rule, comparing the close with the prior intrabar's close. Summing intrabar deltas gives each chart bar's delta.
2. CVD Candles
Delta accumulates into a session CVD that resets on the same anchor as the VWAP (Daily by default). Each CVD candle opens at the prior cumulative value and closes at the new one. Its high and low are the extremes of the running cumulative delta through the bar's intrabars, so wicks show how far aggression pushed within the bar, not just where it finished. Candle brightness reflects relative volume: bright candles are high-RVOL bars, faded candles are normal. A Bar Delta histogram view is available as an alternative.
3. Time-of-Day Relative Volume
Relative volume compares each bar's volume with the average volume of the same time slot over recent sessions (10 by default), not a rolling average of recent bars. Intraday volume is uneven, with surges at session opens and scheduled data, so time-of-day normalisation avoids treating every session open as abnormal.
4. Session VWAP and Bands
KIRON Flow calculates the same volume-weighted VWAP and standard deviation bands as KIRON VWAP Engine, using identical maths and intrabar precision. These levels define where absorption and divergence are assessed. Match the Anchor, Precision, External Volume and band settings between the two indicators so the levels align.
5. External Volume Source
Spot and CFD feeds often report tick volume. When External Volume is enabled, delta is calculated from another symbol's intrabar data (for example, exchange-traded futures on a spot chart), and that symbol's volume also weights the VWAP.
EVENTS
Absorption (A)
Aggressive volume that fails to move price at a key level. All of the following must be true:
- Relative volume at or above the threshold (1.5x by default)
- Bar range no larger than 0.8 x ATR(14)
- Delta opposes the close: for bullish absorption, delta is negative (sellers aggressive) but the bar closes in the upper half of its range; bearish is the mirror
- The bar interacts with a key level: for bullish absorption, it dips to the VWAP and closes on or above it, or trades into lower band 2; bearish is the mirror at the VWAP from below or upper band 2
Interpretation: passive buyers (or sellers) are absorbing aggressive orders at the level.
CVD Divergence (D)
Price reaches a new N-bar extreme (20 bars by default) at least a set number of bars (3 by default) after the previous extreme, inside the selected band zone, while CVD fails to exceed its value at the previous extreme. The comparison uses the intrabar CVD high or low at each extreme. References reset each session, so divergences never compare across sessions.
Interpretation: price is extending while aggressive participation is fading.
FLOW SIGNALS
KIRON Flow's own signals use a two-stage structure: an event creates a setup, and a separate bar must confirm it.
FLOW BUY
Stage 1: a bullish absorption or bullish divergence arms the setup.
Stage 2: within the trigger window (5 bars by default), a bar must close:
- above its open
- above the prior close
- with positive delta
- above lower band 2
The setup is cancelled if price closes below the event bar's low or the window expires. Only one signal fires per setup.
FLOW SELL
The exact mirror, armed by bearish absorption or bearish divergence.
Levels (shown in the label tooltip)
- Stop: beyond the extreme since the event, plus an ATR buffer (0.25 x ATR by default)
- Target 1: the next VWAP level in the trade direction (VWAP, then band 1, then band 2)
- Target 2: the level after Target 1
KIRON VWAP ENGINE (COMPANION)
KIRON VWAP Engine is a multi-anchor VWAP overlay:
- Intrabar-precision VWAP with volume-weighted standard deviation bands at 1, 2 and 3 sigma
- Weekly VWAP, and the previous period's VWAP with untested/tested status
- Optional London, COMEX and custom time anchors
- A slope state (rising, falling or flat, normalised by ATR)
- Two rule-based signal types:
- Trend Pullback (PB): in a trending VWAP, price pulls back to the VWAP without closing beyond band 1, then closes back on the trend side with a rejection wick or a VWAP reclaim.
- Mean Reversion (MR): in a flat VWAP, price tags band 2, then closes back inside with rejection.
Engine signals confirm on bar close, include stop and target levels, and require a minimum reward-to-risk.
HOW THE TWO WORK TOGETHER
Signal Link
KIRON VWAP Engine outputs its signals as a hidden plot named "Signal":
- 1 = Pullback long
- 2 = Mean Reversion long
- -1 = Pullback short
- -2 = Mean Reversion short
- 0 = no signal
KIRON Flow reads this plot through a source input and grades each engine signal on the bar it prints.
Grading Rules
Pullback signals are CONFIRMED when:
- delta on the signal bar agrees with the trade direction, and
- CVD held a higher low through the pullback (lower high for shorts), compared with the lowest (highest) CVD over the prior swing window. If the session is too young to measure the prior swing, only the delta condition is applied.
Mean Reversion signals are CONFIRMED when a divergence or absorption in the trade direction occurred within the confirmation window (5 bars by default).
Any signal that fails is marked UNCONFIRMED.
Display
- Confirmed signals: a check mark in the Flow pane, plus a coloured background highlight on the price chart
- Unconfirmed signals: a grey cross in the Flow pane
Setup
1. Add KIRON VWAP Engine and KIRON Flow to the same chart.
2. In KIRON Flow settings, enable "Grade KVWAP Signals".
3. Set "KVWAP Signal Source" to "KVWAP: Signal".
4. Match Anchor, Precision, External Volume and band multipliers across both indicators.
The Flow table shows "Source not linked" if the source is set incorrectly.
Suggested Workflow
1. Read the VWAP Engine slope. Rising or falling favours Trend Pullback setups; flat favours Mean Reversion at band 2.
2. Read session CVD for context. Rising CVD with price above VWAP indicates buyer control; falling CVD with price below VWAP indicates seller control.
3. Prioritise engine signals that KIRON Flow grades as confirmed.
4. Treat FLOW BUY / FLOW SELL signals as counter-move entries at levels. They carry the most context when aligned with the engine's regime, for example a FLOW SELL at the upper band while the VWAP is flat, or a FLOW BUY at the VWAP while the VWAP is rising.
5. Be cautious with Flow reversal signals against a strongly trending VWAP.
TABLE
- Session CVD and whether buyers or sellers are in control
- Current bar delta
- Relative volume
- Delta data source: Intrabar, or Bar estimate where intrabar history is unavailable
- Last event and bars elapsed
- Last Flow signal
- Last graded engine signal
SETTINGS
Core: anchor, VWAP source, precision, intrabar timeframe, external volume symbol, band multipliers
Delta: estimation method, display mode (CVD Candles or Bar Delta)
Relative Volume: lookback sessions, high-RVOL threshold
Events: divergence lookback, minimum bars between extremes, divergence zone, absorption range limit, price-chart markers
Flow Signals: visibility, price-chart labels, trigger window, stop buffer
KIRON VWAP Link: grading toggle, signal source, confirmation window, prior swing lookback, price-chart highlight
Style: colours, table visibility
ALERTS
- Flow BUY / Flow SELL
- Confirmed KVWAP BUY / Confirmed KVWAP SELL
- Bullish / Bearish CVD Divergence
- Bullish / Bearish Absorption
For Flow signal alerts that include entry, stop and targets, create an alert using the "Any alert() function call" condition.
LIMITATIONS
- Delta is an estimate derived from intrabar OHLCV, not exchange bid/ask trade data. Its quality depends on the data feed; tick-volume feeds produce a weaker approximation than exchange volume.
- Intrabar data is limited by TradingView's lower-timeframe history. Older bars use a chart-bar estimate, shown as "Bar estimate" in the table.
- Relative volume requires several sessions of history per time slot before readings stabilise.
- When using external volume, bars where the external symbol has no data carry zero weight, and differences in trading hours reduce coverage.
- All signals and grades are rule-based, confirm on bar close, and do not account for news, liquidity conditions or broader market context.
DISCLAIMER
This script is provided for educational and informational purposes only and does not constitute financial advice. Order-flow estimates and historical signal behaviour do not guarantee future results. Always apply your own risk management.
KIRON Flow is an order-flow confirmation indicator that estimates buying and selling aggression from intrabar data and evaluates it against session VWAP structure. It plots session Cumulative Volume Delta (CVD) as candles, detects absorption and CVD divergence at key VWAP levels, prints its own two-stage reversal signals, and can grade signals from its companion indicator, KIRON VWAP Engine, as confirmed or unconfirmed by order flow.
The two indicators are designed to answer different questions. KIRON VWAP Engine shows where price is relative to volume-weighted fair value and when a structured setup has formed. KIRON Flow shows whether aggressive participation supports that setup. Each works on its own; used together, they separate setups that have order-flow support from those that do not.
HOW IT WORKS
1. Intrabar Delta Estimation
TradingView does not provide bid/ask trade data, so delta is estimated from lower-timeframe bars (1-minute by default). For each intrabar, volume is split between buyers and sellers using one of two methods:
- Close Location (default): delta = volume x (2 x close - high - low) / (high - low). An intrabar closing at its high counts as fully buyer-initiated, at its low fully seller-initiated, and proportionally in between.
- Up/Down Bar: all of an intrabar's volume is assigned by its direction.
Intrabars with no range fall back to a tick rule, comparing the close with the prior intrabar's close. Summing intrabar deltas gives each chart bar's delta.
2. CVD Candles
Delta accumulates into a session CVD that resets on the same anchor as the VWAP (Daily by default). Each CVD candle opens at the prior cumulative value and closes at the new one. Its high and low are the extremes of the running cumulative delta through the bar's intrabars, so wicks show how far aggression pushed within the bar, not just where it finished. Candle brightness reflects relative volume: bright candles are high-RVOL bars, faded candles are normal. A Bar Delta histogram view is available as an alternative.
3. Time-of-Day Relative Volume
Relative volume compares each bar's volume with the average volume of the same time slot over recent sessions (10 by default), not a rolling average of recent bars. Intraday volume is uneven, with surges at session opens and scheduled data, so time-of-day normalisation avoids treating every session open as abnormal.
4. Session VWAP and Bands
KIRON Flow calculates the same volume-weighted VWAP and standard deviation bands as KIRON VWAP Engine, using identical maths and intrabar precision. These levels define where absorption and divergence are assessed. Match the Anchor, Precision, External Volume and band settings between the two indicators so the levels align.
5. External Volume Source
Spot and CFD feeds often report tick volume. When External Volume is enabled, delta is calculated from another symbol's intrabar data (for example, exchange-traded futures on a spot chart), and that symbol's volume also weights the VWAP.
EVENTS
Absorption (A)
Aggressive volume that fails to move price at a key level. All of the following must be true:
- Relative volume at or above the threshold (1.5x by default)
- Bar range no larger than 0.8 x ATR(14)
- Delta opposes the close: for bullish absorption, delta is negative (sellers aggressive) but the bar closes in the upper half of its range; bearish is the mirror
- The bar interacts with a key level: for bullish absorption, it dips to the VWAP and closes on or above it, or trades into lower band 2; bearish is the mirror at the VWAP from below or upper band 2
Interpretation: passive buyers (or sellers) are absorbing aggressive orders at the level.
CVD Divergence (D)
Price reaches a new N-bar extreme (20 bars by default) at least a set number of bars (3 by default) after the previous extreme, inside the selected band zone, while CVD fails to exceed its value at the previous extreme. The comparison uses the intrabar CVD high or low at each extreme. References reset each session, so divergences never compare across sessions.
Interpretation: price is extending while aggressive participation is fading.
FLOW SIGNALS
KIRON Flow's own signals use a two-stage structure: an event creates a setup, and a separate bar must confirm it.
FLOW BUY
Stage 1: a bullish absorption or bullish divergence arms the setup.
Stage 2: within the trigger window (5 bars by default), a bar must close:
- above its open
- above the prior close
- with positive delta
- above lower band 2
The setup is cancelled if price closes below the event bar's low or the window expires. Only one signal fires per setup.
FLOW SELL
The exact mirror, armed by bearish absorption or bearish divergence.
Levels (shown in the label tooltip)
- Stop: beyond the extreme since the event, plus an ATR buffer (0.25 x ATR by default)
- Target 1: the next VWAP level in the trade direction (VWAP, then band 1, then band 2)
- Target 2: the level after Target 1
KIRON VWAP ENGINE (COMPANION)
KIRON VWAP Engine is a multi-anchor VWAP overlay:
- Intrabar-precision VWAP with volume-weighted standard deviation bands at 1, 2 and 3 sigma
- Weekly VWAP, and the previous period's VWAP with untested/tested status
- Optional London, COMEX and custom time anchors
- A slope state (rising, falling or flat, normalised by ATR)
- Two rule-based signal types:
- Trend Pullback (PB): in a trending VWAP, price pulls back to the VWAP without closing beyond band 1, then closes back on the trend side with a rejection wick or a VWAP reclaim.
- Mean Reversion (MR): in a flat VWAP, price tags band 2, then closes back inside with rejection.
Engine signals confirm on bar close, include stop and target levels, and require a minimum reward-to-risk.
HOW THE TWO WORK TOGETHER
Signal Link
KIRON VWAP Engine outputs its signals as a hidden plot named "Signal":
- 1 = Pullback long
- 2 = Mean Reversion long
- -1 = Pullback short
- -2 = Mean Reversion short
- 0 = no signal
KIRON Flow reads this plot through a source input and grades each engine signal on the bar it prints.
Grading Rules
Pullback signals are CONFIRMED when:
- delta on the signal bar agrees with the trade direction, and
- CVD held a higher low through the pullback (lower high for shorts), compared with the lowest (highest) CVD over the prior swing window. If the session is too young to measure the prior swing, only the delta condition is applied.
Mean Reversion signals are CONFIRMED when a divergence or absorption in the trade direction occurred within the confirmation window (5 bars by default).
Any signal that fails is marked UNCONFIRMED.
Display
- Confirmed signals: a check mark in the Flow pane, plus a coloured background highlight on the price chart
- Unconfirmed signals: a grey cross in the Flow pane
Setup
1. Add KIRON VWAP Engine and KIRON Flow to the same chart.
2. In KIRON Flow settings, enable "Grade KVWAP Signals".
3. Set "KVWAP Signal Source" to "KVWAP: Signal".
4. Match Anchor, Precision, External Volume and band multipliers across both indicators.
The Flow table shows "Source not linked" if the source is set incorrectly.
Suggested Workflow
1. Read the VWAP Engine slope. Rising or falling favours Trend Pullback setups; flat favours Mean Reversion at band 2.
2. Read session CVD for context. Rising CVD with price above VWAP indicates buyer control; falling CVD with price below VWAP indicates seller control.
3. Prioritise engine signals that KIRON Flow grades as confirmed.
4. Treat FLOW BUY / FLOW SELL signals as counter-move entries at levels. They carry the most context when aligned with the engine's regime, for example a FLOW SELL at the upper band while the VWAP is flat, or a FLOW BUY at the VWAP while the VWAP is rising.
5. Be cautious with Flow reversal signals against a strongly trending VWAP.
TABLE
- Session CVD and whether buyers or sellers are in control
- Current bar delta
- Relative volume
- Delta data source: Intrabar, or Bar estimate where intrabar history is unavailable
- Last event and bars elapsed
- Last Flow signal
- Last graded engine signal
SETTINGS
Core: anchor, VWAP source, precision, intrabar timeframe, external volume symbol, band multipliers
Delta: estimation method, display mode (CVD Candles or Bar Delta)
Relative Volume: lookback sessions, high-RVOL threshold
Events: divergence lookback, minimum bars between extremes, divergence zone, absorption range limit, price-chart markers
Flow Signals: visibility, price-chart labels, trigger window, stop buffer
KIRON VWAP Link: grading toggle, signal source, confirmation window, prior swing lookback, price-chart highlight
Style: colours, table visibility
ALERTS
- Flow BUY / Flow SELL
- Confirmed KVWAP BUY / Confirmed KVWAP SELL
- Bullish / Bearish CVD Divergence
- Bullish / Bearish Absorption
For Flow signal alerts that include entry, stop and targets, create an alert using the "Any alert() function call" condition.
LIMITATIONS
- Delta is an estimate derived from intrabar OHLCV, not exchange bid/ask trade data. Its quality depends on the data feed; tick-volume feeds produce a weaker approximation than exchange volume.
- Intrabar data is limited by TradingView's lower-timeframe history. Older bars use a chart-bar estimate, shown as "Bar estimate" in the table.
- Relative volume requires several sessions of history per time slot before readings stabilise.
- When using external volume, bars where the external symbol has no data carry zero weight, and differences in trading hours reduce coverage.
- All signals and grades are rule-based, confirm on bar close, and do not account for news, liquidity conditions or broader market context.
DISCLAIMER
This script is provided for educational and informational purposes only and does not constitute financial advice. Order-flow estimates and historical signal behaviour do not guarantee future results. Always apply your own risk management.

כתב ויתור
המידע והפרסומים אינם מיועדים להיות, ואינם מהווים, ייעוץ או המלצה פיננסית, השקעתית, מסחרית או מכל סוג אחר המסופקת או מאושרת על ידי TradingView. קרא עוד ב־תנאי השימוש.
כתב ויתור
המידע והפרסומים אינם מיועדים להיות, ואינם מהווים, ייעוץ או המלצה פיננסית, השקעתית, מסחרית או מכל סוג אחר המסופקת או מאושרת על ידי TradingView. קרא עוד ב־תנאי השימוש.