OPEN-SOURCE SCRIPT
מעודכן Compression Pressure Map [AGPro Series]
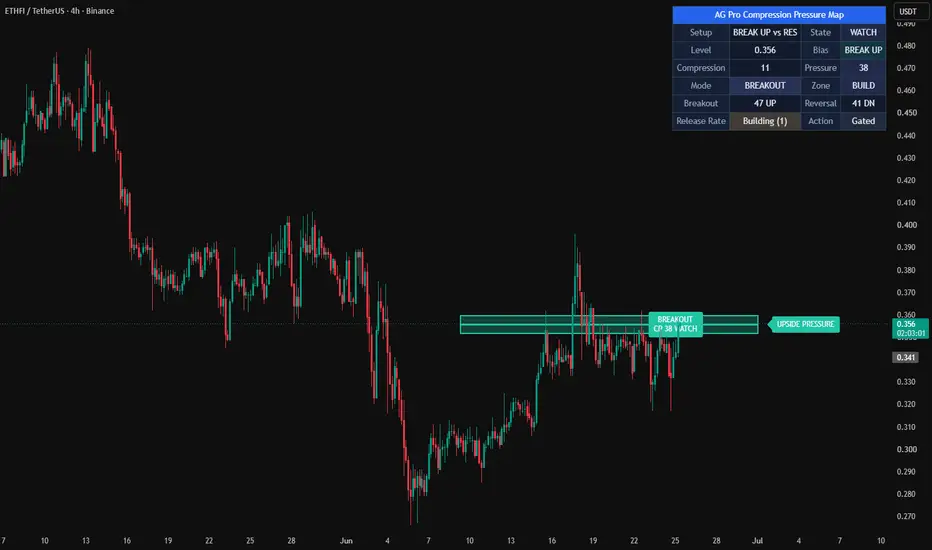
Compression Pressure Map [AGPro Series]
⚡ Overview
────────────────────────────────────────
Compression Pressure Map is a structural context tool that measures how tightly price is compressing against the nearest pivot-based level, and evaluates two behavioral scenarios in parallel: breakout anticipation and reversal watch. The output is a visual map of where pressure is accumulating — rendered as an evolving pressure zone that moves through BUILDING, ARMED and READY states.
This is not a signal engine, not a forecast, and not a trading strategy. It is a visualization layer that answers a single question: where is compression building around the active level, and in which direction is that pressure leaning.
🧭 Unique Edge
────────────────────────────────────────
Most compression indicators reduce behavior to a single direction. CPM separates compression into two parallel scoring engines that run on the same structural core:
🔹 Breakout Anticipation — pressure building for a directional break through the level
🔹 Reversal Watch — pressure building for a rejection at the level
In Auto mode the dominant scenario is rendered on the chart (cleaner visual), while the panel shows both scores side by side for transparency. Power users can lock the engine to a single mode. The active level is stabilized with a clustered pivot refinement and a drift-control lock, so the displayed level stays consistent instead of jumping on every new pivot. A compression gate keeps the pressure score aligned with the compression core: when compression is weak, pressure cannot escalate into high states.
🧪 Methodology
────────────────────────────────────────
The pressure score is a weighted composite of six structural components, measured on the active scenario:
🔹 Range compression (short-window range vs long-window range)
🔹 ATR compression (short-window ATR vs long-window ATR)
🔹 Body tightness (average body size relative to average range)
🔹 Quiet-bar persistence (how many recent bars qualify as calm)
🔹 Proximity to the active level (normalized by ATR)
🔹 Directional posture (slope, close position in bar)
Reversal scoring adds wick-rejection weight at the active level (average lower-wick size for bull reversals, upper-wick size for bear reversals). Breakout scoring adds approach slope weight toward the active level. A shared EMA smoothing step produces calmer state transitions. A dominance margin and cooldown prevent rapid scenario flipping. The final score is driven through a BUILDING → ARMED → READY state machine with hysteresis on the zone visibility to avoid flicker.
🎯 Signals & Alerts
────────────────────────────────────────
The state machine produces four transition alerts plus two pace alerts:
🔹 Pressure Armed Near Level — score crosses the armed threshold with an active scenario
🔹 Ready Zone Reached — score crosses the ready threshold with an active scenario
🔹 Armed Bullish / Bearish Scenario — directional armed transitions
🔹 Ready Bullish / Bearish Scenario — directional ready transitions
🔹 Pressure Rising — score is climbing while the zone is live
🔹 Pressure Released — the active scenario resolves (through the level or by decay)
On the chart, state transitions are marked with discrete A and R markers on the active side. A score label near price always shows the current pressure value, bias and state for quick reading without opening the panel.
⚙️ Key Inputs
────────────────────────────────────────
🔹 Engine Mode — Auto, Breakout Anticipation, or Reversal Watch
🔹 Compression Length — main lookback for range, ATR and body tightening
🔹 Trigger Distance (ATR) — how close price must be to a level to start evaluating
🔹 Hold Distance (ATR) — how far price can drift before the active context is cleared
🔹 Pivot Left/Right and Cluster Tolerance — pivot strength and blending behavior
🔹 Compression Gate and Gate Threshold — compression-first discipline control
🔹 Armed / Ready / Zone On / Zone Off Thresholds — state machine calibration
🔹 Full visual controls — zone width, band extend, line width, label size, panel position and font
All defaults are tuned for mid-volatility crypto pairs on 1H and 4H timeframes, but the engine adapts across symbols and timeframes through its ATR-normalized distance logic.
📘 How to Use
────────────────────────────────────────
🔹 Open the indicator in Auto mode and observe which scenario the panel highlights
🔹 Wait for the pressure zone to appear on the chart (BUILD → LIVE transition)
🔹 Read the state: BUILDING means the setup is forming, ARMED means the setup is mature, READY means compression and proximity are both at peak
🔹 Cross-reference with your own structural read — CPM describes the compression landscape, the decision is yours
🔹 If you prefer one behavioral lens only, lock the engine to Breakout Anticipation or Reversal Watch
🔹 Use the Compression Gate to enforce compression-first discipline — when compression is weak, the pressure score stays in WATCH
🔹 The tool is timeframe-agnostic; try it on 15m, 1H, 4H and 1D to see how compression contexts nest
CPM is designed to sit alongside your strategy, not replace it. It maps the compression field; you read the context.
⚠️ Limitations & Transparency
────────────────────────────────────────
🔹 CPM is a context visualization tool, not a signal generator — it does not issue buy or sell calls
🔹 The pressure score is a structural measurement, not a probability estimate
🔹 State transitions describe the compression field at the moment they print; they do not imply what happens next
🔹 Active level refinement is intentionally conservative — the level may feel slower to update than raw pivots, by design
🔹 Very high volatility regimes may keep the compression score low for extended periods, which is the intended behavior
🔹 The tool is deterministic on closed bars; intrabar values are provisional until bar close
CPM is released as Public, Open-source under MPL 2.0. The source is fully readable and auditable.
🛡️ Risk Disclosure
────────────────────────────────────────
This indicator is published for educational and analytical purposes only. It is not financial advice, not a trading strategy, and not a recommendation to buy or sell any asset. Past behavior of any level or pressure state does not predict future behavior. Markets carry risk of loss; users are solely responsible for their own decisions and risk management. Always do your own research and consider consulting a qualified professional before making trading or investment decisions.
⚡ Overview
────────────────────────────────────────
Compression Pressure Map is a structural context tool that measures how tightly price is compressing against the nearest pivot-based level, and evaluates two behavioral scenarios in parallel: breakout anticipation and reversal watch. The output is a visual map of where pressure is accumulating — rendered as an evolving pressure zone that moves through BUILDING, ARMED and READY states.
This is not a signal engine, not a forecast, and not a trading strategy. It is a visualization layer that answers a single question: where is compression building around the active level, and in which direction is that pressure leaning.
🧭 Unique Edge
────────────────────────────────────────
Most compression indicators reduce behavior to a single direction. CPM separates compression into two parallel scoring engines that run on the same structural core:
🔹 Breakout Anticipation — pressure building for a directional break through the level
🔹 Reversal Watch — pressure building for a rejection at the level
In Auto mode the dominant scenario is rendered on the chart (cleaner visual), while the panel shows both scores side by side for transparency. Power users can lock the engine to a single mode. The active level is stabilized with a clustered pivot refinement and a drift-control lock, so the displayed level stays consistent instead of jumping on every new pivot. A compression gate keeps the pressure score aligned with the compression core: when compression is weak, pressure cannot escalate into high states.
🧪 Methodology
────────────────────────────────────────
The pressure score is a weighted composite of six structural components, measured on the active scenario:
🔹 Range compression (short-window range vs long-window range)
🔹 ATR compression (short-window ATR vs long-window ATR)
🔹 Body tightness (average body size relative to average range)
🔹 Quiet-bar persistence (how many recent bars qualify as calm)
🔹 Proximity to the active level (normalized by ATR)
🔹 Directional posture (slope, close position in bar)
Reversal scoring adds wick-rejection weight at the active level (average lower-wick size for bull reversals, upper-wick size for bear reversals). Breakout scoring adds approach slope weight toward the active level. A shared EMA smoothing step produces calmer state transitions. A dominance margin and cooldown prevent rapid scenario flipping. The final score is driven through a BUILDING → ARMED → READY state machine with hysteresis on the zone visibility to avoid flicker.
🎯 Signals & Alerts
────────────────────────────────────────
The state machine produces four transition alerts plus two pace alerts:
🔹 Pressure Armed Near Level — score crosses the armed threshold with an active scenario
🔹 Ready Zone Reached — score crosses the ready threshold with an active scenario
🔹 Armed Bullish / Bearish Scenario — directional armed transitions
🔹 Ready Bullish / Bearish Scenario — directional ready transitions
🔹 Pressure Rising — score is climbing while the zone is live
🔹 Pressure Released — the active scenario resolves (through the level or by decay)
On the chart, state transitions are marked with discrete A and R markers on the active side. A score label near price always shows the current pressure value, bias and state for quick reading without opening the panel.
⚙️ Key Inputs
────────────────────────────────────────
🔹 Engine Mode — Auto, Breakout Anticipation, or Reversal Watch
🔹 Compression Length — main lookback for range, ATR and body tightening
🔹 Trigger Distance (ATR) — how close price must be to a level to start evaluating
🔹 Hold Distance (ATR) — how far price can drift before the active context is cleared
🔹 Pivot Left/Right and Cluster Tolerance — pivot strength and blending behavior
🔹 Compression Gate and Gate Threshold — compression-first discipline control
🔹 Armed / Ready / Zone On / Zone Off Thresholds — state machine calibration
🔹 Full visual controls — zone width, band extend, line width, label size, panel position and font
All defaults are tuned for mid-volatility crypto pairs on 1H and 4H timeframes, but the engine adapts across symbols and timeframes through its ATR-normalized distance logic.
📘 How to Use
────────────────────────────────────────
🔹 Open the indicator in Auto mode and observe which scenario the panel highlights
🔹 Wait for the pressure zone to appear on the chart (BUILD → LIVE transition)
🔹 Read the state: BUILDING means the setup is forming, ARMED means the setup is mature, READY means compression and proximity are both at peak
🔹 Cross-reference with your own structural read — CPM describes the compression landscape, the decision is yours
🔹 If you prefer one behavioral lens only, lock the engine to Breakout Anticipation or Reversal Watch
🔹 Use the Compression Gate to enforce compression-first discipline — when compression is weak, the pressure score stays in WATCH
🔹 The tool is timeframe-agnostic; try it on 15m, 1H, 4H and 1D to see how compression contexts nest
CPM is designed to sit alongside your strategy, not replace it. It maps the compression field; you read the context.
⚠️ Limitations & Transparency
────────────────────────────────────────
🔹 CPM is a context visualization tool, not a signal generator — it does not issue buy or sell calls
🔹 The pressure score is a structural measurement, not a probability estimate
🔹 State transitions describe the compression field at the moment they print; they do not imply what happens next
🔹 Active level refinement is intentionally conservative — the level may feel slower to update than raw pivots, by design
🔹 Very high volatility regimes may keep the compression score low for extended periods, which is the intended behavior
🔹 The tool is deterministic on closed bars; intrabar values are provisional until bar close
CPM is released as Public, Open-source under MPL 2.0. The source is fully readable and auditable.
🛡️ Risk Disclosure
────────────────────────────────────────
This indicator is published for educational and analytical purposes only. It is not financial advice, not a trading strategy, and not a recommendation to buy or sell any asset. Past behavior of any level or pressure state does not predict future behavior. Markets carry risk of loss; users are solely responsible for their own decisions and risk management. Always do your own research and consider consulting a qualified professional before making trading or investment decisions.
הערות שחרור
UPDATE NOTES - V3.3This update focuses on publication readability, label spacing, and cleaner default chart presentation.
The core purpose of the script remains unchanged.
This release improves how the active pressure band is presented across 1H, 4H, 1D, and 1W chart views.
This script continues to function as an analytical and visualization tool.
It does not attempt to predict price direction or provide guaranteed outcomes.
------------------------
What Changed
------------------------
* Changed Show Score Label default to Off.
The score label remains available from settings, but the default view now avoids repeating the same information already shown by the zone badge and panel.
* Added Zone Badge Anchor.
The centered pressure badge can now be shifted within the pressure band. Default is 0.72 so the badge sits closer to the forward projection area and is less likely to overlap active candles.
* Preserved centered pressure-zone badges.
The pressure band still carries its own readable ownership badge by default.
* Preserved the core Compression Pressure Map engine.
Compression scoring, scenario scoring, active level mapping, state logic, panel metrics, and alerts remain unchanged.
------------------------
Visual Improvements
------------------------
* Reduced duplicate label information on dense intraday views.
* Improved badge spacing inside the active pressure band.
* Reduced visual overlap between the zone badge and recent candles.
* Kept the chart informative without making the pressure map feel crowded.
------------------------
Interface & Usability
------------------------
* Users can still re-enable the score label from settings when reviewing historical pressure states.
* Zone Badge Anchor gives manual control over badge placement without changing the pressure engine.
* Default settings now prioritize publication screenshots and first-glance clarity.
------------------------
Behavior Notes
------------------------
This update does not change the core analytical logic of the script.
Outputs should still be read as compression context, scenario pressure, and level interaction mapping.
The goal is to improve clarity and usability, not to introduce predictive behavior.
------------------------
Limitations Reminder
------------------------
The script remains a rule-based analytical tool.
Market conditions such as volatility, liquidity, timeframe differences, pivot sensitivity, and compression quality may affect how pressure states appear.
Outputs should always be interpreted within broader market context.
------------------------
Risk Reminder
------------------------
This script is for educational and analytical purposes only.
It does not provide financial advice or guaranteed trading outcomes.
Users remain responsible for their own decisions.
הערות שחרור
🔧 UPDATE NOTES - 3.4This update focuses on readability, decision support, and contrast.
The core purpose of the script remains unchanged.
This release improves how the existing compression-pressure logic is presented and
interpreted on the chart, and adds a stop-aware reference statistic plus a clear
next-action read in the panel.
This script continues to function as an analytical and visualization tool.
It does not attempt to predict price direction or provide guaranteed outcomes.
------------------------
What Changed
------------------------
• Added a Release Rate to the panel
A new statistic tracks how many past armed contexts followed through by a target
distance in the expected direction before reversing to an opposite stop. Both levels
are frozen at the arm bar, samples are evaluated only on confirmed bars, and a
context that neither reaches its target nor its stop within the window times out
without counting. The panel shows "Building (n)" until enough samples exist, then a
tier-colored percentage with the sample count.
• Added an Action read
The panel now ends with a plain next-action cell (Watch release / Arming / Released /
Building / Gated / Stand aside) so the current state maps directly to what to do.
• Improved on-chart text contrast
The centered zone badge, the level tag, the watch tag, the optional score label, and
the Armed/Ready markers now use a luminance-aware text color, so text stays sharp on
bright green and pink fills instead of washing out.
• Hardened volatility reference
The ATR fallback used by the new statistic resolves to true range on the very first
bars, keeping spacing stable on freshly loaded or low-history symbols.
------------------------
Visual Improvements
------------------------
• Improved chart readability by recoloring all label and marker text for contrast
• Reduced visual clutter so the centered badge stays legible inside the band
• Refined the panel hierarchy so Release Rate and Action sit on a dedicated row
• Kept the existing band, level line, and tag positioning intact
------------------------
Interface & Usability
------------------------
• Optimized panel layout to pair a quality read with a backward-looking statistic
• Improved label readability for clearer first-glance interpretation
• Adjusted text colors for a more balanced premium appearance
• Enhanced overall user experience without changing core logic
------------------------
Behavior Notes
------------------------
This update does not change the core analytical logic of the script.
The Release Rate is a descriptive, backward-looking statistic. It is not a prediction
and does not guarantee that any future armed context will follow through.
Users should interpret outputs the same way as before, but with improved visual
structure and an added follow-through reference.
------------------------
Limitations Reminder
------------------------
The script remains a rule-based analytical tool.
Market conditions such as volatility, liquidity, and timeframe differences may affect
how pressure contexts and the Release Rate appear.
Outputs should always be interpreted within broader market context.
------------------------
Risk Reminder
------------------------
This script is for educational and analytical purposes only.
It does not provide financial advice or guaranteed trading outcomes.
Users remain responsible for their own decisions.
סקריפט קוד פתוח
ברוח האמיתית של TradingView, יוצר הסקריפט הזה הפך אותו לקוד פתוח, כך שסוחרים יוכלו לעיין בו ולאמת את פעולתו. כל הכבוד למחבר! אמנם ניתן להשתמש בו בחינם, אך זכור כי פרסום חוזר של הקוד כפוף ל־כללי הבית שלנו.

Public-free scripts + invite-only AGPro workflows for market analysis, liquidity context, risk planning and execution review.
Rules-based. No hype. No guesswork.
Library & access: agprolabs.com/
Telegram: t.me/agprolabs
Rules-based. No hype. No guesswork.
Library & access: agprolabs.com/
Telegram: t.me/agprolabs
כתב ויתור
המידע והפרסומים אינם מיועדים להיות, ואינם מהווים, ייעוץ או המלצה פיננסית, השקעתית, מסחרית או מכל סוג אחר המסופקת או מאושרת על ידי TradingView. קרא עוד ב־תנאי השימוש.
סקריפט קוד פתוח
ברוח האמיתית של TradingView, יוצר הסקריפט הזה הפך אותו לקוד פתוח, כך שסוחרים יוכלו לעיין בו ולאמת את פעולתו. כל הכבוד למחבר! אמנם ניתן להשתמש בו בחינם, אך זכור כי פרסום חוזר של הקוד כפוף ל־כללי הבית שלנו.
Public-free scripts + invite-only AGPro workflows for market analysis, liquidity context, risk planning and execution review.
Rules-based. No hype. No guesswork.
Library & access: agprolabs.com/
Telegram: t.me/agprolabs
Rules-based. No hype. No guesswork.
Library & access: agprolabs.com/
Telegram: t.me/agprolabs
כתב ויתור
המידע והפרסומים אינם מיועדים להיות, ואינם מהווים, ייעוץ או המלצה פיננסית, השקעתית, מסחרית או מכל סוג אחר המסופקת או מאושרת על ידי TradingView. קרא עוד ב־תנאי השימוש.