Stretch and Push Oscillator
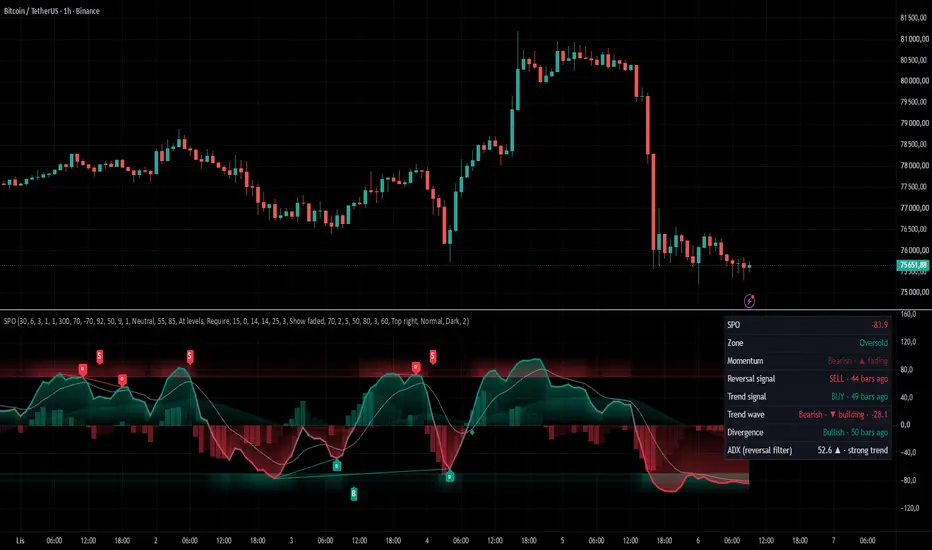
█ OVERVIEW
Stretch and Push Oscillator (SPO) is an oscillator that assesses two things at once: how far price has moved from its mean, and whether the move still has strength behind it. The two components form a single line in the range from −100 to +100. A momentum histogram, a trend wave, divergences and two families of signals complete the picture.
The indicator is built on a simple observation. Price being far from its mean does not by itself mean the move is ending, because a strong trend can keep price "too far" for a long time. The warning comes when price is still stretched but consecutive candles stop printing new highs or lows. The move then starts running out of fuel and the odds of a pullback or reversal increase. This is not a rule, however. The oscillator shows the state of the market, and the decision is up to the trader.
Signals fall into two families, distinguished by the marker shape:
• REVERSAL (triangle ▲▼): the oscillator returns from the overbought or oversold zone, i.e. a signal against the current move,
• TREND (diamond ◆): a zero-line cross confirmed by a building histogram, i.e. a signal with the move.
A dashboard in the corner of the pane completes the picture. It shows the oscillator value, the zone, momentum, the latest signal of each family, the trend wave direction, the latest divergence and trend strength by ADX, along with the number of bars since each event.
█ CONCEPTS
Stretch: distance from the mean (slow component)
Measures the distance of the close from the average price (30 candles by default), expressed in units of the typical candle range over the same period. The deviation is therefore judged against current volatility: the same move in points means more in a calm market than in a volatile one.
Push: strength of the latest candles (fast component)
For each of the latest candles (6 by default) it checks whether the candle broke the previous high more strongly (+1) or the previous low (−1). A candle that broke neither contributes nothing (0). Each vote is weighted by the candle's range relative to the average range (up to 3×), so large candles count more than small ones. When price is still stretched but Push fades, the move is losing momentum.
How the components form the oscillator line
Stretch and Push measure different things in different units, so they cannot simply be added together. Each component is first converted to a common scale. The indicator compares its current value with the last 300 candles and turns it into a position in the range from −100 to +100. +100 means the highest reading of that period, −100 the lowest, and 0 a typical reading. A reading of +80 means the current value is higher than 90% of readings. After this conversion, both components answer the same question: how unusual is the current situation compared with the last few hundred candles.
The oscillator line is the average of the two converted components (equal weights by default), lightly smoothed. In practice:
• the line approaches ±100 only when both components are extreme at the same time: price is far from its mean and candles are still pushing hard in the same direction,
• when only one component is extreme and the other is neutral, the line stops roughly halfway, around ±50,
• when the components point in opposite directions, they cancel each other out and the line returns towards zero.
Push reacts quickly and Stretch slowly, so in a typical up move they change at different times (a down move works the same way in reverse):
• at the start of the move, Push rises first. Candles begin printing higher highs even though price has not yet moved away from its mean. The line crosses zero earlier than Stretch alone would,
• in the middle of the move, both components are high and the line enters the overbought zone,
• at the end of the move, Push fades first. Candles stop printing new highs even though price is still far from its mean. The line starts to fall and leaves the zone before price clearly turns. This is the moment the indicator marks with a REVERSAL signal.
The weights let you change the balance between the components:
• a higher Stretch weight emphasizes that the market has gone "too far", and the line stays in the zone longer,
• a higher Push weight gives earlier warnings of a fading move, at the cost of more signals.
OB/OS zones
+70 (overbought) and −70 (oversold) by default. Zone intensity can depend on the oscillator's distance: the zone is barely visible when the oscillator is far away and becomes more pronounced as it approaches. The oscillator line is gray near zero and gains full color as it approaches the levels.
Average and histogram
The oscillator average (EMA 9) marks short-term momentum, and the histogram shows the distance between the oscillator and this average. A strong bar color means momentum is building, a pale one that it is fading. Pale bars while the oscillator is still in the OB/OS zone are an early warning that the move is exhausting.
Trend wave
A long EMA of the oscillator (50 by default), drawn as a semi-transparent wave between it and the zero line. A wave above zero means buyers dominate, below zero that sellers do. It provides context for short oscillator swings and can filter TREND signals.
REVERSAL signals
Buy: the oscillator exits the oversold zone upwards. Sell: the oscillator exits the overbought zone downwards. Two filters apply to them:
• the ADX filter lets a signal through when ADX is below the threshold (25 by default) or falling, i.e. when the trend is weak or weakening. Taking positions against a strong trend is the riskiest. Filtered signals can remain on the chart as faded markers,
• the confirmation filter (off by default) shows the signal only once a later candle closes above the high (buy) or below the low (sell) of the signal candle. A signal pending confirmation can be shown as a faded marker.
When a divergence in the same direction appears close to the signal (within 15 candles by default), the indicator adds a B or S label. This marks a higher-quality signal. In "Require" mode, only such signals are shown on the chart. A divergence can also bypass the ADX filter, because divergences naturally form while the trend is still strong.
TREND signals
Buy: the oscillator crosses above zero and the histogram above zero rises for at least 2 consecutive candles. Sell: the oscillator crosses below zero and the histogram below zero deepens for at least 2 consecutive candles. If the histogram condition is not met on the cross candle, the signal can still appear for a few more candles (5 by default), as long as the oscillator stays on the same side of zero. Each cross produces at most one signal. By default, diamonds appear only in the direction of the trend wave. The ADX and confirmation filters do not apply to them.
Divergences
The indicator looks for regular divergences:
• bullish: price makes a lower low while the oscillator makes a higher low,
• bearish: price makes a higher high while the oscillator makes a lower high.
An oscillator high or low is confirmed once it has 3 candles on each side without a new extreme. Additional conditions, each of which can be disabled:
• the first extreme lies in the OB/OS zone, and later extremes are compared with the latest extreme inside the zone, so smaller swings in between do not break the pattern,
• the divergence line does not cross the oscillator,
• the second extreme lies on the correct side of zero.
The line and the "D" label are drawn at the extreme itself, while the alert and the dashboard entry appear on the confirmation candle.
█ FEATURES
• Oscillator combining distance from the mean (Stretch) and the strength of the latest candles (Push).
• Percentile-rank normalization of both components to the ±100 range.
• Adjustable weight for each component.
• OB/OS zones with dynamic intensity depending on the oscillator's distance.
• Oscillator line colored by deviation strength, with an optional glow.
• Oscillator average and momentum histogram distinguishing building and fading phases.
• Trend wave (long EMA of the oscillator) as directional context.
• REVERSAL signals with an ADX filter and optional confirmation by a signal-candle breakout.
• Linking of signals with divergences (B/S labels) in Ignore, Mark and Require modes.
• TREND signals with a building-histogram condition and a trend wave filter.
• Regular divergences with zone, clean-line and zero-side filters.
• Filtered and pending signals shown as faded markers.
• Signals on bar close only (default), with no flickering or disappearing.
• Markers at the levels or on the oscillator line.
• Dashboard with the market state and the number of bars since each event, with dark and light themes.
• Ten alerts: signals of both families, divergence-backed signals, trend wave side changes and divergences.
█ APPLICATIONS
Assessing move exhaustion
The oscillator in the OB/OS zone with pale histogram bars shows that the market is stretched and the strength of the move is fading. This is the moment to start looking for signs of a reversal, but not a signal in itself.
Entries against the move
Triangles mark a return from the zone. B/S labels, i.e. divergence-backed signals, carry the most information. The ADX filter limits signals in a strong trend, and the confirmation filter removes some false zone exits at the cost of a later entry.
Entries with the move
Diamonds mark a zero-line cross confirmed by building momentum, by default only in the direction of the trend wave. They are suited to joining a move after a pullback.
Directional context
The trend wave shows which side of the market dominates over a longer horizon. A REVERSAL signal in the direction of the wave is usually a return to the trend after a pullback, while a signal against the wave is an attempt to catch the end of the trend.
Example of use
SPO is best treated as a source of information about the state of the move rather than a ready-made trading system. Before making a decision it is worth taking into account:
• the signal family (against the move or with it),
• the presence of a divergence (B/S label),
• the direction of the trend wave,
• trend strength by ADX,
• the histogram phase (building or fading),
• price structure and support and resistance levels,
• the broader context and higher timeframes.
█ NOTES
• Percentile rank shows how extreme a reading is relative to the last 300 candles, not in absolute terms. After a long quiet period, even a moderate move can produce an extreme reading. During a long trend, the scale adapts to it.
• Normalization needs history, so the oscillator may not be calculated at the very beginning of the available data.
• In a strong trend the oscillator can stay in the OB/OS zone for a long time, and the first exit from the zone does not have to mean the end of the move.
• Divergence highs and lows are confirmed with a delay equal to the number of confirmation candles. A B/S label may therefore appear a few candles after the triangle, on the candle where the divergence is confirmed.
• Smoothing and the oscillator averages delay signals by 1–2 candles.
• When signals on bar close only are disabled, signals appear while the candle is forming and may disappear before it closes.
• A signal pending confirmation is cancelled by a signal in the opposite direction or once the set bar limit is exceeded.
• Filtered (faded) signals do not trigger alerts and do not appear in the dashboard.
Stretch and Push Oscillator (SPO) is an oscillator that assesses two things at once: how far price has moved from its mean, and whether the move still has strength behind it. The two components form a single line in the range from −100 to +100. A momentum histogram, a trend wave, divergences and two families of signals complete the picture.
The indicator is built on a simple observation. Price being far from its mean does not by itself mean the move is ending, because a strong trend can keep price "too far" for a long time. The warning comes when price is still stretched but consecutive candles stop printing new highs or lows. The move then starts running out of fuel and the odds of a pullback or reversal increase. This is not a rule, however. The oscillator shows the state of the market, and the decision is up to the trader.
Signals fall into two families, distinguished by the marker shape:
• REVERSAL (triangle ▲▼): the oscillator returns from the overbought or oversold zone, i.e. a signal against the current move,
• TREND (diamond ◆): a zero-line cross confirmed by a building histogram, i.e. a signal with the move.
A dashboard in the corner of the pane completes the picture. It shows the oscillator value, the zone, momentum, the latest signal of each family, the trend wave direction, the latest divergence and trend strength by ADX, along with the number of bars since each event.
█ CONCEPTS
Stretch: distance from the mean (slow component)
Measures the distance of the close from the average price (30 candles by default), expressed in units of the typical candle range over the same period. The deviation is therefore judged against current volatility: the same move in points means more in a calm market than in a volatile one.
Push: strength of the latest candles (fast component)
For each of the latest candles (6 by default) it checks whether the candle broke the previous high more strongly (+1) or the previous low (−1). A candle that broke neither contributes nothing (0). Each vote is weighted by the candle's range relative to the average range (up to 3×), so large candles count more than small ones. When price is still stretched but Push fades, the move is losing momentum.
How the components form the oscillator line
Stretch and Push measure different things in different units, so they cannot simply be added together. Each component is first converted to a common scale. The indicator compares its current value with the last 300 candles and turns it into a position in the range from −100 to +100. +100 means the highest reading of that period, −100 the lowest, and 0 a typical reading. A reading of +80 means the current value is higher than 90% of readings. After this conversion, both components answer the same question: how unusual is the current situation compared with the last few hundred candles.
The oscillator line is the average of the two converted components (equal weights by default), lightly smoothed. In practice:
• the line approaches ±100 only when both components are extreme at the same time: price is far from its mean and candles are still pushing hard in the same direction,
• when only one component is extreme and the other is neutral, the line stops roughly halfway, around ±50,
• when the components point in opposite directions, they cancel each other out and the line returns towards zero.
Push reacts quickly and Stretch slowly, so in a typical up move they change at different times (a down move works the same way in reverse):
• at the start of the move, Push rises first. Candles begin printing higher highs even though price has not yet moved away from its mean. The line crosses zero earlier than Stretch alone would,
• in the middle of the move, both components are high and the line enters the overbought zone,
• at the end of the move, Push fades first. Candles stop printing new highs even though price is still far from its mean. The line starts to fall and leaves the zone before price clearly turns. This is the moment the indicator marks with a REVERSAL signal.
The weights let you change the balance between the components:
• a higher Stretch weight emphasizes that the market has gone "too far", and the line stays in the zone longer,
• a higher Push weight gives earlier warnings of a fading move, at the cost of more signals.
OB/OS zones
+70 (overbought) and −70 (oversold) by default. Zone intensity can depend on the oscillator's distance: the zone is barely visible when the oscillator is far away and becomes more pronounced as it approaches. The oscillator line is gray near zero and gains full color as it approaches the levels.
Average and histogram
The oscillator average (EMA 9) marks short-term momentum, and the histogram shows the distance between the oscillator and this average. A strong bar color means momentum is building, a pale one that it is fading. Pale bars while the oscillator is still in the OB/OS zone are an early warning that the move is exhausting.
Trend wave
A long EMA of the oscillator (50 by default), drawn as a semi-transparent wave between it and the zero line. A wave above zero means buyers dominate, below zero that sellers do. It provides context for short oscillator swings and can filter TREND signals.
REVERSAL signals
Buy: the oscillator exits the oversold zone upwards. Sell: the oscillator exits the overbought zone downwards. Two filters apply to them:
• the ADX filter lets a signal through when ADX is below the threshold (25 by default) or falling, i.e. when the trend is weak or weakening. Taking positions against a strong trend is the riskiest. Filtered signals can remain on the chart as faded markers,
• the confirmation filter (off by default) shows the signal only once a later candle closes above the high (buy) or below the low (sell) of the signal candle. A signal pending confirmation can be shown as a faded marker.
When a divergence in the same direction appears close to the signal (within 15 candles by default), the indicator adds a B or S label. This marks a higher-quality signal. In "Require" mode, only such signals are shown on the chart. A divergence can also bypass the ADX filter, because divergences naturally form while the trend is still strong.
TREND signals
Buy: the oscillator crosses above zero and the histogram above zero rises for at least 2 consecutive candles. Sell: the oscillator crosses below zero and the histogram below zero deepens for at least 2 consecutive candles. If the histogram condition is not met on the cross candle, the signal can still appear for a few more candles (5 by default), as long as the oscillator stays on the same side of zero. Each cross produces at most one signal. By default, diamonds appear only in the direction of the trend wave. The ADX and confirmation filters do not apply to them.
Divergences
The indicator looks for regular divergences:
• bullish: price makes a lower low while the oscillator makes a higher low,
• bearish: price makes a higher high while the oscillator makes a lower high.
An oscillator high or low is confirmed once it has 3 candles on each side without a new extreme. Additional conditions, each of which can be disabled:
• the first extreme lies in the OB/OS zone, and later extremes are compared with the latest extreme inside the zone, so smaller swings in between do not break the pattern,
• the divergence line does not cross the oscillator,
• the second extreme lies on the correct side of zero.
The line and the "D" label are drawn at the extreme itself, while the alert and the dashboard entry appear on the confirmation candle.
█ FEATURES
• Oscillator combining distance from the mean (Stretch) and the strength of the latest candles (Push).
• Percentile-rank normalization of both components to the ±100 range.
• Adjustable weight for each component.
• OB/OS zones with dynamic intensity depending on the oscillator's distance.
• Oscillator line colored by deviation strength, with an optional glow.
• Oscillator average and momentum histogram distinguishing building and fading phases.
• Trend wave (long EMA of the oscillator) as directional context.
• REVERSAL signals with an ADX filter and optional confirmation by a signal-candle breakout.
• Linking of signals with divergences (B/S labels) in Ignore, Mark and Require modes.
• TREND signals with a building-histogram condition and a trend wave filter.
• Regular divergences with zone, clean-line and zero-side filters.
• Filtered and pending signals shown as faded markers.
• Signals on bar close only (default), with no flickering or disappearing.
• Markers at the levels or on the oscillator line.
• Dashboard with the market state and the number of bars since each event, with dark and light themes.
• Ten alerts: signals of both families, divergence-backed signals, trend wave side changes and divergences.
█ APPLICATIONS
Assessing move exhaustion
The oscillator in the OB/OS zone with pale histogram bars shows that the market is stretched and the strength of the move is fading. This is the moment to start looking for signs of a reversal, but not a signal in itself.
Entries against the move
Triangles mark a return from the zone. B/S labels, i.e. divergence-backed signals, carry the most information. The ADX filter limits signals in a strong trend, and the confirmation filter removes some false zone exits at the cost of a later entry.
Entries with the move
Diamonds mark a zero-line cross confirmed by building momentum, by default only in the direction of the trend wave. They are suited to joining a move after a pullback.
Directional context
The trend wave shows which side of the market dominates over a longer horizon. A REVERSAL signal in the direction of the wave is usually a return to the trend after a pullback, while a signal against the wave is an attempt to catch the end of the trend.
Example of use
SPO is best treated as a source of information about the state of the move rather than a ready-made trading system. Before making a decision it is worth taking into account:
• the signal family (against the move or with it),
• the presence of a divergence (B/S label),
• the direction of the trend wave,
• trend strength by ADX,
• the histogram phase (building or fading),
• price structure and support and resistance levels,
• the broader context and higher timeframes.
█ NOTES
• Percentile rank shows how extreme a reading is relative to the last 300 candles, not in absolute terms. After a long quiet period, even a moderate move can produce an extreme reading. During a long trend, the scale adapts to it.
• Normalization needs history, so the oscillator may not be calculated at the very beginning of the available data.
• In a strong trend the oscillator can stay in the OB/OS zone for a long time, and the first exit from the zone does not have to mean the end of the move.
• Divergence highs and lows are confirmed with a delay equal to the number of confirmation candles. A B/S label may therefore appear a few candles after the triangle, on the candle where the divergence is confirmed.
• Smoothing and the oscillator averages delay signals by 1–2 candles.
• When signals on bar close only are disabled, signals appear while the candle is forming and may disappear before it closes.
• A signal pending confirmation is cancelled by a signal in the opposite direction or once the set bar limit is exceeded.
• Filtered (faded) signals do not trigger alerts and do not appear in the dashboard.

כתב ויתור
המידע והפרסומים אינם מיועדים להיות, ואינם מהווים, ייעוץ או המלצה פיננסית, השקעתית, מסחרית או מכל סוג אחר המסופקת או מאושרת על ידי TradingView. קרא עוד ב־תנאי השימוש.
כתב ויתור
המידע והפרסומים אינם מיועדים להיות, ואינם מהווים, ייעוץ או המלצה פיננסית, השקעתית, מסחרית או מכל סוג אחר המסופקת או מאושרת על ידי TradingView. קרא עוד ב־תנאי השימוש.