OPEN-SOURCE SCRIPT
מעודכן Kitty's Law [theUltimator5]
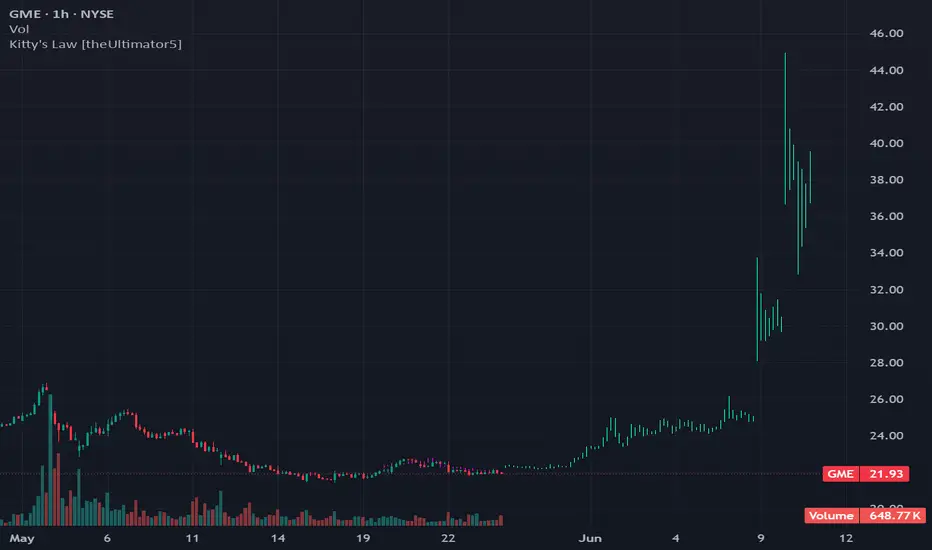
MOASS is tomorrow.
MOASS will always be tomorrow.
Murphy's law states anything that can go wrong will go wrong.
With GameStop, we have something called Kitty’s law.
Kitty’s law states that whenever people can fit in a March-May 2024 fractal, people will fit in a March-May 2024 fractal.
This indicator is an embodiment of Kitty's law.
This indicator matches the current price action to the GME fractal from 2024, finds a best fit section, then projects forwards the resulting price action. A short squeeze has never been so near!
HOW IT WORKS
Now getting into the technical aspects of this indicator, since it is a bit more complicated than the silly description has it seem.
The values from 2024 are hard coded into arrays. There are two arrays. Hourly and daily. If the timeframe is set to daily, it will use the daily array for comparison. If any other timeframe, it will use hourly (yes I know that weekly, monthly etc... are correlating to hourly but deal with it)
The indicator then uses a lookback period off the current bar (you can define the length) and finds the best fit section match from the selected array (hourly or daily) using a custom Pearson correlation algorithm. Once it finds the best fit section match, it plots it over the chart and projects the rest of the array onto the chart, filling out the fractal.
If the ticker you are looking at is NOT GME, then it won't project anything. Instead, it will tell you to stop looking at bad tickers and go back to GME.
Disclaimer: This indicator is meant for fun and is NOT a technical analysis indicator and is cosmetic only!
הערות שחרור
Added support for extended hours.Also added data for the 4-hour chart.
Fallback period is the 1H still if the chart is set to anything other than 1H, 4H, or D.
הערות שחרור
Fixed the 1H extended data. The last bar that it plotted looked quite bearish. Never end a forwards bullish projection on a bearish candle. Now it is all bull...הערות שחרור
Added option to use auto correlation length. This sweeps over a number of segment lengths and plots the best fit segment. Disabled by default. Can be enabled.סקריפט קוד פתוח
ברוח האמיתית של TradingView, יוצר הסקריפט הזה הפך אותו לקוד פתוח, כך שסוחרים יוכלו לעיין בו ולאמת את פעולתו. כל הכבוד למחבר! אמנם ניתן להשתמש בו בחינם, אך זכור כי פרסום חוזר של הקוד כפוף ל־כללי הבית שלנו.

כתב ויתור
המידע והפרסומים אינם מיועדים להיות, ואינם מהווים, ייעוץ או המלצה פיננסית, השקעתית, מסחרית או מכל סוג אחר המסופקת או מאושרת על ידי TradingView. קרא עוד ב־תנאי השימוש.
סקריפט קוד פתוח
ברוח האמיתית של TradingView, יוצר הסקריפט הזה הפך אותו לקוד פתוח, כך שסוחרים יוכלו לעיין בו ולאמת את פעולתו. כל הכבוד למחבר! אמנם ניתן להשתמש בו בחינם, אך זכור כי פרסום חוזר של הקוד כפוף ל־כללי הבית שלנו.
כתב ויתור
המידע והפרסומים אינם מיועדים להיות, ואינם מהווים, ייעוץ או המלצה פיננסית, השקעתית, מסחרית או מכל סוג אחר המסופקת או מאושרת על ידי TradingView. קרא עוד ב־תנאי השימוש.