מעודכן
Volume Profile Suite
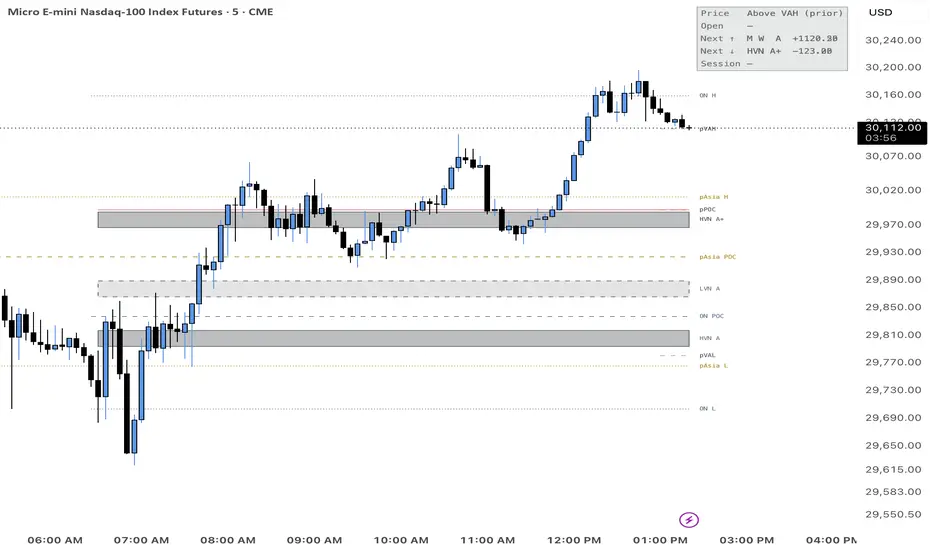
VP Suite: Volume Profile, Value Areas & Multi-Timeframe Levels
VP Suite shows where volume actually traded and turns it into clear, graded levels for planning your day.
What it shows
Session profiles: volume at each price, split into buyers and sellers. The split is estimated from lower-timeframe candles.
POC, VAH and VAL: the most-traded price and the value area that holds 70% of the volume.
Prior-day value area: yesterday’s VAH, POC and VAL as dashed lines.
Carried POCs: previous sessions’ POCs, kept on the chart until price trades through them.
HVN zones: high-volume areas where price tends to slow down and react.
LVN zones: low-volume gaps that price tends to move through fast or reject hard.
MTF confluence zones: levels where the monthly, weekly and daily profiles agree. They’re tagged like M W D and graded A+ (all three agree), A (two) or B (one).
Status panel: where price sits compared with value, where the session opened, the nearest zone above and below with the distance in points, and today’s buy/sell split.
How to use it
Before the open: note the nearest A+ and A zones above and below price, plus any carried POC nearby.
Plan scenarios:
If price breaks an LVN, the next HVN is the likely target.
If price rejects at an LVN, expect a rotation back to the HVN it came from.
During the session: wait for price to reach a zone and watch how it reacts. A stall at an HVN, a sharp rejection at an LVN, or a clean break followed by a retest each show you who’s in control.
Rule of thumb: price rests at HVNs and travels through LVNs.
Quick settings
Preset: Minimal, Standard or Full.
Theme: Auto, Light or Dark.
Session: ETH (the full 24-hour session) or RTH (9:30–16:00 New York).
Focus: the zones nearest price stay strong and the rest fade.
Works on any intraday timeframe and is tuned for futures such as NQ/MNQ. It’s a tool for reading the market, not trading advice.
VP Suite shows where volume actually traded and turns it into clear, graded levels for planning your day.
What it shows
Session profiles: volume at each price, split into buyers and sellers. The split is estimated from lower-timeframe candles.
POC, VAH and VAL: the most-traded price and the value area that holds 70% of the volume.
Prior-day value area: yesterday’s VAH, POC and VAL as dashed lines.
Carried POCs: previous sessions’ POCs, kept on the chart until price trades through them.
HVN zones: high-volume areas where price tends to slow down and react.
LVN zones: low-volume gaps that price tends to move through fast or reject hard.
MTF confluence zones: levels where the monthly, weekly and daily profiles agree. They’re tagged like M W D and graded A+ (all three agree), A (two) or B (one).
Status panel: where price sits compared with value, where the session opened, the nearest zone above and below with the distance in points, and today’s buy/sell split.
How to use it
Before the open: note the nearest A+ and A zones above and below price, plus any carried POC nearby.
Plan scenarios:
If price breaks an LVN, the next HVN is the likely target.
If price rejects at an LVN, expect a rotation back to the HVN it came from.
During the session: wait for price to reach a zone and watch how it reacts. A stall at an HVN, a sharp rejection at an LVN, or a clean break followed by a retest each show you who’s in control.
Rule of thumb: price rests at HVNs and travels through LVNs.
Quick settings
Preset: Minimal, Standard or Full.
Theme: Auto, Light or Dark.
Session: ETH (the full 24-hour session) or RTH (9:30–16:00 New York).
Focus: the zones nearest price stay strong and the rest fade.
Works on any intraday timeframe and is tuned for futures such as NQ/MNQ. It’s a tool for reading the market, not trading advice.
הערות שחרור
VP Suite: Volume Profile, Value Areas & Multi-Timeframe LevelsVP Suite shows where volume actually traded and turns it into clear, graded levels for planning your day.
What it shows
Session profiles: volume at each price, split into buyers and sellers. The split is estimated from lower-timeframe candles.
POC, VAH and VAL: the most-traded price and the value area that holds 70% of the volume.
Prior-day value area: yesterday’s VAH, POC and VAL as dashed lines.
Carried POCs: previous sessions’ POCs, kept on the chart until price trades through them.
HVN zones: high-volume areas where price tends to slow down and react.
LVN zones: low-volume gaps that price tends to move through fast or reject hard.
MTF confluence zones: levels where the monthly, weekly and daily profiles agree. They’re tagged like M W D and graded A+ (all three agree), A (two) or B (one).
Status panel: where price sits compared with value, where the session opened, the nearest zone above and below with the distance in points, and today’s buy/sell split.
How to use it
Before the open: note the nearest A+ and A zones above and below price, plus any carried POC nearby.
Plan scenarios:
If price breaks an LVN, the next HVN is the likely target.
If price rejects at an LVN, expect a rotation back to the HVN it came from.
During the session: wait for price to reach a zone and watch how it reacts. A stall at an HVN, a sharp rejection at an LVN, or a clean break followed by a retest each show you who’s in control.
Rule of thumb: price rests at HVNs and travels through LVNs.
Quick settings
Preset: Minimal, Standard or Full.
Theme: Auto, Light or Dark.
Session: ETH (the full 24-hour session) or RTH (9:30–16:00 New York).
Focus: the zones nearest price stay strong and the rest fade.
Works on any intraday timeframe and is tuned for futures such as NQ/MNQ. It’s a tool for reading the market, not trading advice.
הערות שחרור
You can now set Rows up to 200, under Session Profiles and also MTF Confluence,הערות שחרור
Bug Fixהערות שחרור
Updated.הערות שחרור
Updateהערות שחרור
Updateהערות שחרור
Updateהערות שחרור
v5• Added previous Asia high / low / POC and overnight (Globex) high / low / POC levels.
• New defaults tuned for a levels-only setup.
• Asia alert now tracks the previous Asia range.
הערות שחרור
Update
כתב ויתור
המידע והפרסומים אינם מיועדים להיות, ואינם מהווים, ייעוץ או המלצה פיננסית, השקעתית, מסחרית או מכל סוג אחר המסופקת או מאושרת על ידי TradingView. קרא עוד ב־תנאי השימוש.
כתב ויתור
המידע והפרסומים אינם מיועדים להיות, ואינם מהווים, ייעוץ או המלצה פיננסית, השקעתית, מסחרית או מכל סוג אחר המסופקת או מאושרת על ידי TradingView. קרא עוד ב־תנאי השימוש.