מעודכן
Mr Oatto US Stock Hunter
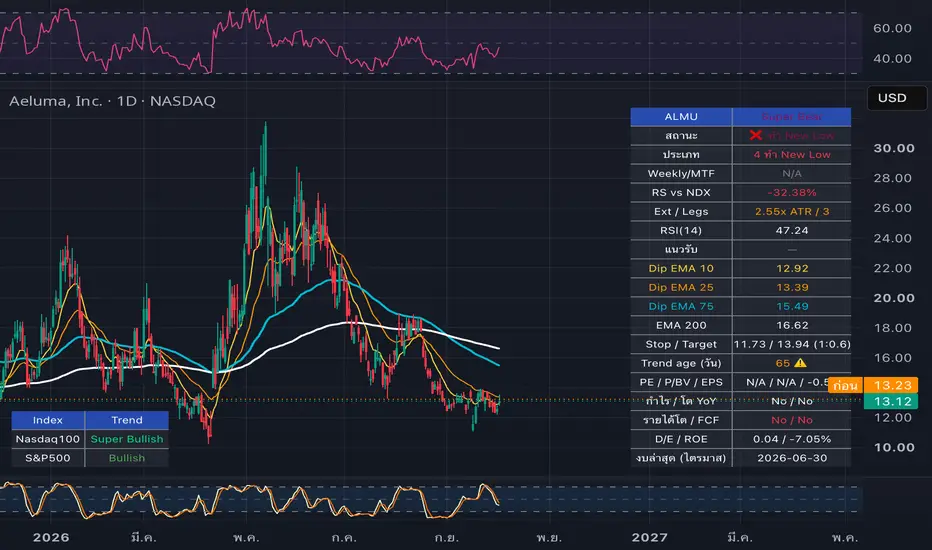
**Mr Oatto Runtrend Stock — Daily-Anchored Trend & Pullback Analyzer**
A trend-following / swing-trading toolkit built around a 5-EMA ribbon (5/15/35/89/200), designed to answer one question whenever you open any symbol: *is this a good time to run the trend, or should I wait for a pullback?*
**Why "Daily-anchored"?**
Every analytical metric in this script (trend classification, trade-ready status, ATR stop/target, extension, swing-leg count, trend age, and relative strength) is computed on the Daily timeframe internally via `request.security`, regardless of which chart timeframe you currently have open. This means the numbers stay consistent whether you're looking at a 1H, 4H, or Weekly chart. Only the plotted EMA lines on the chart follow your current chart resolution, so the visual stays clean and relevant to whatever timeframe you're zoomed into.
**Key Features**
- **EMA Trend Classification** — Super Bullish / Bullish / Sideway Up / Sideway Down / Downtrend / Super Bear, based on EMA stack alignment (Daily).
- **Weekly MTF Filter** — confirms whether the Daily trend aligns with the Weekly trend (higher-timeframe confirmation).
- **Relative Strength vs SET Index** — measures whether the stock is outperforming or underperforming the SET index over the same Daily lookback window.
- **Chase-Risk Filter** — flags when price has already run too far from the EMA35 (in ATR multiples or %) or has formed too many swing legs since the trend began, switching the recommendation from "ready to run the trend" to "wait for a pullback" instead of chasing an extended move.
- **Swing-Leg Counter** — a simplified pivot-based proxy for "how many legs has this move made." This is NOT a true Elliott Wave count. Automated Elliott Wave labeling is inherently subjective and unreliable; this feature is intentionally a rough heuristic, not a wave-count claim.
- **ATR-Based Stop/Target** — suggested stop-loss and take-profit levels sized by Daily ATR, with a configurable reward:risk ratio.
- **Trend Age / Overextension Warning** — flags when the current trend regime has persisted unusually long.
- **Fundamentals Snapshot** — PE ratio, profitability, and YoY earnings growth for the symbol on your chart.
- **Market Overview** — SET / SET50 / SET100 index trend at a glance.
- **Built-in Alerts** — trend flips, cut warnings, overextension, chase-risk, and pullback-entry signals.
- **Three independent panels** (Trend / Edge Metrics / Market) that can each be repositioned and resized independently to avoid overlap on your chart.
**How to Read It**
1. Check the **Trend Panel** (bottom-right by default) for the overall Trade Status — this is the quick answer.
2. Check the **Edge Panel** (bottom-left by default) for the reasoning behind that status: Weekly alignment, relative strength, extension, swing legs, and suggested risk levels.
3. Check the **Market Panel** (top-right by default) for the broader SET market context.
**Settings**
All EMA periods, ATR multipliers, extension thresholds, swing-pivot sensitivity, and panel positions/text size are configurable via the indicator settings, organized into logical groups.
**Disclaimer**
This script is for educational and informational purposes only. It does not constitute financial advice, and past trend behavior does not guarantee future results. The swing-leg counter is a simplified heuristic, not a validated Elliott Wave count. Always apply your own risk management and position sizing. Trade at your own risk.
A trend-following / swing-trading toolkit built around a 5-EMA ribbon (5/15/35/89/200), designed to answer one question whenever you open any symbol: *is this a good time to run the trend, or should I wait for a pullback?*
**Why "Daily-anchored"?**
Every analytical metric in this script (trend classification, trade-ready status, ATR stop/target, extension, swing-leg count, trend age, and relative strength) is computed on the Daily timeframe internally via `request.security`, regardless of which chart timeframe you currently have open. This means the numbers stay consistent whether you're looking at a 1H, 4H, or Weekly chart. Only the plotted EMA lines on the chart follow your current chart resolution, so the visual stays clean and relevant to whatever timeframe you're zoomed into.
**Key Features**
- **EMA Trend Classification** — Super Bullish / Bullish / Sideway Up / Sideway Down / Downtrend / Super Bear, based on EMA stack alignment (Daily).
- **Weekly MTF Filter** — confirms whether the Daily trend aligns with the Weekly trend (higher-timeframe confirmation).
- **Relative Strength vs SET Index** — measures whether the stock is outperforming or underperforming the SET index over the same Daily lookback window.
- **Chase-Risk Filter** — flags when price has already run too far from the EMA35 (in ATR multiples or %) or has formed too many swing legs since the trend began, switching the recommendation from "ready to run the trend" to "wait for a pullback" instead of chasing an extended move.
- **Swing-Leg Counter** — a simplified pivot-based proxy for "how many legs has this move made." This is NOT a true Elliott Wave count. Automated Elliott Wave labeling is inherently subjective and unreliable; this feature is intentionally a rough heuristic, not a wave-count claim.
- **ATR-Based Stop/Target** — suggested stop-loss and take-profit levels sized by Daily ATR, with a configurable reward:risk ratio.
- **Trend Age / Overextension Warning** — flags when the current trend regime has persisted unusually long.
- **Fundamentals Snapshot** — PE ratio, profitability, and YoY earnings growth for the symbol on your chart.
- **Market Overview** — SET / SET50 / SET100 index trend at a glance.
- **Built-in Alerts** — trend flips, cut warnings, overextension, chase-risk, and pullback-entry signals.
- **Three independent panels** (Trend / Edge Metrics / Market) that can each be repositioned and resized independently to avoid overlap on your chart.
**How to Read It**
1. Check the **Trend Panel** (bottom-right by default) for the overall Trade Status — this is the quick answer.
2. Check the **Edge Panel** (bottom-left by default) for the reasoning behind that status: Weekly alignment, relative strength, extension, swing legs, and suggested risk levels.
3. Check the **Market Panel** (top-right by default) for the broader SET market context.
**Settings**
All EMA periods, ATR multipliers, extension thresholds, swing-pivot sensitivity, and panel positions/text size are configurable via the indicator settings, organized into logical groups.
**Disclaimer**
This script is for educational and informational purposes only. It does not constitute financial advice, and past trend behavior does not guarantee future results. The swing-leg counter is a simplified heuristic, not a validated Elliott Wave count. Always apply your own risk management and position sizing. Trade at your own risk.
הערות שחרור
Update Corrected Trend analysis הערות שחרור
**Mr Oatto US Stock Hunter: changelog****Major update**
- Rebuilt on the Runtrend engine, with EMA values kept at 10 / 25 / 75 / 75 / 200.
- Added stock classification into four types (1 strong uptrend, 2 reversal, 3 downtrend losing momentum, 4 new low / avoid) plus a neutral type 0.
- Added an RSI(14) support-zone rule: support moves from EMA 10/25 to EMA 75 when RSI breaks 50, then to EMA 200 if price closes below EMA 75.
- Added Stop and Target. Stop sits below the active EMA support with an ATR buffer. Target is the last confirmed swing high above price, with a 1:2 fallback. The dashboard shows the achieved reward-to-risk ratio.
- Added a trade status row with clearer labels: Long, Short, Wait for Pullback, Caution, Avoid, Watch, Reversal Confirm Above 200, and Cut First.
- Added Chase Risk, which flags extension from EMA 75, overextended trends, and late-stage swing counts. These change the status to Wait for Pullback.
- Added a weekly trend filter (Daily vs Weekly alignment) and relative strength versus Nasdaq100.
**Fundamentals (quarterly)**
- PE, P/BV (estimated), EPS, profit and YoY growth, revenue growth, free cash flow, debt-to-equity, ROE, and the latest report date.
- P/BV and ROE are estimates. ROE uses quarterly earnings, so it is not annualized.
**Layout**
- Replaced the three separate panels with one dashboard plus one market table to avoid overlap.
- The market table shows Nasdaq100 and S&P500 trends and now defaults to the bottom-left corner.
- The dashboard defaults to the bottom-right corner.
- If EMA Slow and EMA Filter are set to the same value, the dashboard shows one "Dip EMA" row instead of two identical rows.
**Alerts (9 total)**
- Trend Turned Bullish
- Trend Turned Bearish
- Cut Warning
- Trend Overextended
- Chase Risk: Wait for Pullback
- RSI Broke 50: Support Shift
- Reversal Type 2 Entered
- New Low: Avoid
- Pullback Entry Signal
**Before you publish**
- The file compiled cleanly before the last two edits (the default market table position and the duplicate EMA row). Compile it once more in the Pine Editor before publishing.
- It has not been tested on a live US chart yet. Check the dashboard on a phone-sized screen before you publish.
- The header comment in the file still says the dashboard has "not more than 13 rows". That is out of date, and I can fix it if you want.

כתב ויתור
המידע והפרסומים אינם מיועדים להיות, ואינם מהווים, ייעוץ או המלצה פיננסית, השקעתית, מסחרית או מכל סוג אחר המסופקת או מאושרת על ידי TradingView. קרא עוד ב־תנאי השימוש.
כתב ויתור
המידע והפרסומים אינם מיועדים להיות, ואינם מהווים, ייעוץ או המלצה פיננסית, השקעתית, מסחרית או מכל סוג אחר המסופקת או מאושרת על ידי TradingView. קרא עוד ב־תנאי השימוש.