Low-Pass Bands [ChartPrime]
More exclusive indicators from ChartPrime
Subscribe to ChartPrime Plus for $117.00/month to get exclusive indicators by this author. You pay right on TradingView and can use them on your charts straight away.
Explore ChartPrime Plus⯁ OVERVIEW
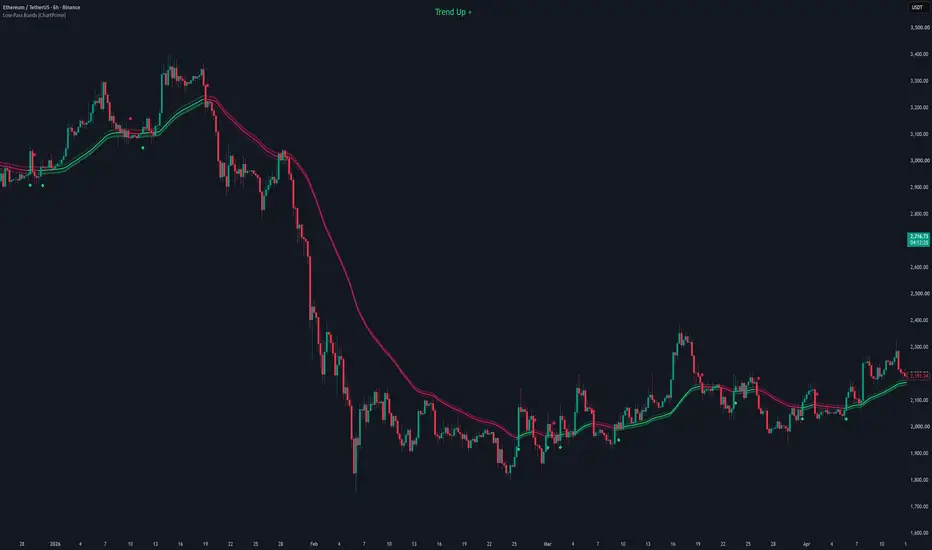
The Low-Pass Bands [ChartPrime] indicator employs a low-pass filter to smooth market noise and highlight trend direction. It consists of an upper band, a lower band, and a central line. The bands are calculated based on a user-defined percentage distance from the smoothed central line, derived using a low-pass filter. The indicator also features dynamic color-coding and bar coloring to help traders quickly identify potential trend shifts and momentum.
⯁ KEY FEATURES & HOW TO USE
⯌ Low-Pass Filtered Bands:
The indicator utilizes a low-pass filter to smooth the input source (e.g., hlc3) over a specified length. It then calculates upper and lower bands as a percentage distance from this smoothed value. The central line and the bands adapt to market movements, filtering out short-term noise and focusing on the overall trend.
Pine Script®
Use: Traders can use these bands to identify the general trend direction. The price oscillating between the bands indicates consolidation, while crossing the bands signifies potential trend shifts.

⯌ Trend Detection and Signals:
The indicator detects trend changes by identifying crossovers between the price and the upper or lower bands. When the price crosses above the upper band, it signals a potential upward trend. Conversely, crossing below the lower band signals a potential downward trend. Diamond markers are plotted on the chart to highlight these trend changes.
Use: Traders can use these crossover signals to identify entry and exit points, taking long positions on bullish crossovers and short positions on bearish crossovers.


⯌ Dynamic Color-Coding:
The bands and central line are dynamically color-coded based on the price’s relation to them. If the price is above the lower band, the color changes to indicate a positive trend, while being below changes it to a negative trend color. This color-coding extends to the candlesticks when the bar coloring option is enabled.
Use: The color-coding provides an immediate visual representation of the trend's current state, allowing traders to quickly assess market conditions.
⯌ Trend Information Display:
The indicator displays trend information in text format on the chart, indicating whether the current trend is "Trend Up" or "Trend Down." Additionally, the indicator denotes momentum by adding a "+" for strong trends. The color of the trend text changes to match the trend direction.
Use: This trend display offers a clear and concise summary of the market's direction and momentum, aiding traders in making informed trading decisions.
Trend Losing momentum:


Trends with Strong Momentum:


⯁ USER INPUTS
⯁ CONCLUSION
The Low-Pass Bands [ChartPrime] indicator provides a robust way to visualize market trends and potential shifts by filtering out short-term noise using a low-pass filter. Its dynamic bands, trend detection signals, and color-coded visual cues make it a versatile tool for identifying trend direction and momentum. The addition of trend information directly on the chart further enhances its utility, offering traders a clear and concise overview of the market's current state.
The Low-Pass Bands [ChartPrime] indicator employs a low-pass filter to smooth market noise and highlight trend direction. It consists of an upper band, a lower band, and a central line. The bands are calculated based on a user-defined percentage distance from the smoothed central line, derived using a low-pass filter. The indicator also features dynamic color-coding and bar coloring to help traders quickly identify potential trend shifts and momentum.
⯁ KEY FEATURES & HOW TO USE
⯌ Low-Pass Filtered Bands:
The indicator utilizes a low-pass filter to smooth the input source (e.g., hlc3) over a specified length. It then calculates upper and lower bands as a percentage distance from this smoothed value. The central line and the bands adapt to market movements, filtering out short-term noise and focusing on the overall trend.
Use: Traders can use these bands to identify the general trend direction. The price oscillating between the bands indicates consolidation, while crossing the bands signifies potential trend shifts.
⯌ Trend Detection and Signals:
The indicator detects trend changes by identifying crossovers between the price and the upper or lower bands. When the price crosses above the upper band, it signals a potential upward trend. Conversely, crossing below the lower band signals a potential downward trend. Diamond markers are plotted on the chart to highlight these trend changes.
Use: Traders can use these crossover signals to identify entry and exit points, taking long positions on bullish crossovers and short positions on bearish crossovers.
⯌ Dynamic Color-Coding:
The bands and central line are dynamically color-coded based on the price’s relation to them. If the price is above the lower band, the color changes to indicate a positive trend, while being below changes it to a negative trend color. This color-coding extends to the candlesticks when the bar coloring option is enabled.
Use: The color-coding provides an immediate visual representation of the trend's current state, allowing traders to quickly assess market conditions.
⯌ Trend Information Display:
The indicator displays trend information in text format on the chart, indicating whether the current trend is "Trend Up" or "Trend Down." Additionally, the indicator denotes momentum by adding a "+" for strong trends. The color of the trend text changes to match the trend direction.
Use: This trend display offers a clear and concise summary of the market's direction and momentum, aiding traders in making informed trading decisions.
Trend Losing momentum:
Trends with Strong Momentum:
⯁ USER INPUTS
- Length: Sets the length for the low-pass filter, determining the degree of smoothing.
- % Distance: Defines the percentage distance from the central line for the upper and lower bands.
- Source: Selects the data source for calculations (default: hlc3).
- Color + / -: Choose colors for positive and negative trends.
- Bars Color: Toggle for coloring bars according to the trend.
⯁ CONCLUSION
The Low-Pass Bands [ChartPrime] indicator provides a robust way to visualize market trends and potential shifts by filtering out short-term noise using a low-pass filter. Its dynamic bands, trend detection signals, and color-coded visual cues make it a versatile tool for identifying trend direction and momentum. The addition of trend information directly on the chart further enhances its utility, offering traders a clear and concise overview of the market's current state.

כתב ויתור
המידע והפרסומים אינם מיועדים להיות, ואינם מהווים, ייעוץ או המלצה פיננסית, השקעתית, מסחרית או מכל סוג אחר המסופקת או מאושרת על ידי TradingView. קרא עוד ב־תנאי השימוש.
כתב ויתור
המידע והפרסומים אינם מיועדים להיות, ואינם מהווים, ייעוץ או המלצה פיננסית, השקעתית, מסחרית או מכל סוג אחר המסופקת או מאושרת על ידי TradingView. קרא עוד ב־תנאי השימוש.