Gann Projector by Santiago Rebello
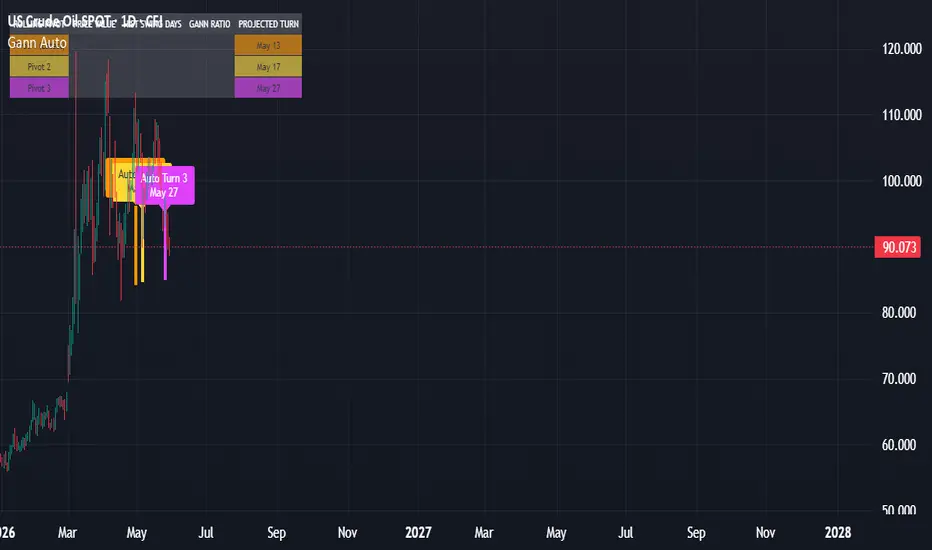
📊 Concept OverviewThe Automated Rolling Gann Projector is a mathematical time-and-price projection system that automates W.D. Gann’s core principles of geometric cycle tracking.Instead of relying on rigid, manual user configuration inputs that expire as the market advances, this indicator uses an autonomous structural engine to constantly track real-time price action, detect structural swing milestones, and project dynamic cycle turn coordinates infinitely forward into the blank chart space.🛠️ Technical Architecture & Core EngineDynamic Pivot Arrays: The script continually monitors price volatility to isolate the three most recent verified structural pivots (highs/lows) via custom strength inputs. As a new swing forms, the underlying memory array rolls automatically—discarding expired cycles and locking fresh reference points.Automated Price-to-Time Scaled Vectors: The indicator measures the exact elapsed calendar time (in days) between the discovered historical market points and establishes an expansion coefficient ($Ratio = Price_A / Price_B$). This dynamic geometric factor is multiplied by historical swing duration to project upcoming cyclic targets.True Timeline Translation Mapping: A major challenge with mathematical time projections is that while the standard calendar counts weekends, trading charts completely skip them. This script uses an advanced, flattened time-to-bar interpolation matrix to ensure the projected target boxes align accurately across the future timeline, skipping weekend and holiday data gaps cleanly.Persistent Analytical HUD: Features a clean, floating dashboard table positioned dynamically to display active pivot configurations, localized turn dates synchronized with the exchange's timezone (syminfo.timezone), and underlying geometric ratios at a quick glance.💡 How to Use This ToolPivot Left/Right Strength: Customize the structural depth of the tracking engine. Higher values look for long-term macroscopic swing phases, while lower values capture fast, intraday structural microcycles.Visual Convergence Zones: Watch for areas where multiple automated target boxes cluster near the same day coordinates—these overlapping zones highlight strong mathematical time windows.

כתב ויתור
המידע והפרסומים אינם מיועדים להיות, ואינם מהווים, ייעוץ או המלצה פיננסית, השקעתית, מסחרית או מכל סוג אחר המסופקת או מאושרת על ידי TradingView. קרא עוד ב־תנאי השימוש.
כתב ויתור
המידע והפרסומים אינם מיועדים להיות, ואינם מהווים, ייעוץ או המלצה פיננסית, השקעתית, מסחרית או מכל סוג אחר המסופקת או מאושרת על ידי TradingView. קרא עוד ב־תנאי השימוש.